
FIGURE
Fig. S7
- ID
- ZDB-FIG-130910-33
- Publication
- Kim et al., 2013 - Multi-organ Abnormalities and mTORC1 Activation in Zebrafish Model of Multiple Acyl-CoA Dehydrogenase Deficiency
- Other Figures
- All Figure Page
- Back to All Figure Page
Fig. S7
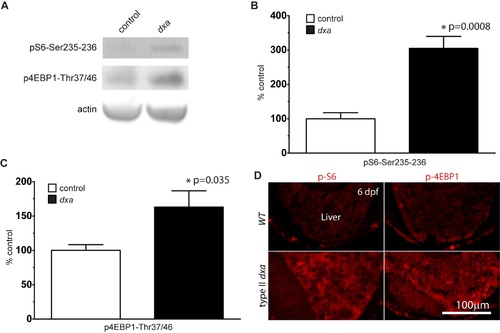
mTORC1 activation in dxavu463 at 6 dpf. (A) Immunoblot blots for phospho-S6Ser235/236 and phosphor-4E-BP1Thr37/46 in control sibling and dxa mutant zebrafish at 6 dpf. (B) Relative ratio of phospho-S6 amount in control and dxa mutants, p = 0.0003. (C) Relative ratio of phosphor-4E-BP1 amount in control and dxa mutants. P = 0.035, n = 5 samples per genotype, each samples contained 2 larvae. p = 0.0246. (D) Phospho-S6 (left panel) and phospho-4E-BP1 staining (right panel) in the liver of WT (top) and type II dxa (bottom) zebrafish at 6 dpf. Scale bar = 100 μm. |
Expression Data
Expression Detail
Antibody Labeling
Phenotype Data
Phenotype Detail
Acknowledgments
This image is the copyrighted work of the attributed author or publisher, and
ZFIN has permission only to display this image to its users.
Additional permissions should be obtained from the applicable author or publisher of the image.
Full text @ PLoS Genet.