
FIGURE
Fig. 7
- ID
- ZDB-FIG-130910-26
- Publication
- Kim et al., 2013 - Multi-organ Abnormalities and mTORC1 Activation in Zebrafish Model of Multiple Acyl-CoA Dehydrogenase Deficiency
- Other Figures
- All Figure Page
- Back to All Figure Page
Fig. 7
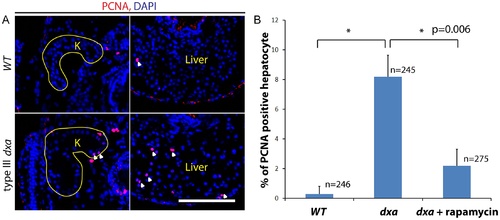
Increased proliferation in dxavu463 mutant kidney and liver. (A) PCNA staining in the kidney and liver of wild type (top) and type III dxa mutant (bottom). Yellow lines indicate kidneys. DAPI (blue) was used for nuclei staining. (B) PCNA positive cells were counted from three different WT, dxa mutant and rapamycin treated dxa mutant liver section. N = 246 (WT), 245 (dxa), 275 (dxa + rapamycin) cells. *p = 0.006 for both comparisons. |
Expression Data
Expression Detail
Antibody Labeling
Phenotype Data
| Fish: | |
|---|---|
| Observed In: | |
| Stage: | Days 7-13 |
Phenotype Detail
Acknowledgments
This image is the copyrighted work of the attributed author or publisher, and
ZFIN has permission only to display this image to its users.
Additional permissions should be obtained from the applicable author or publisher of the image.
Full text @ PLoS Genet.