
Image
|
Figure Caption
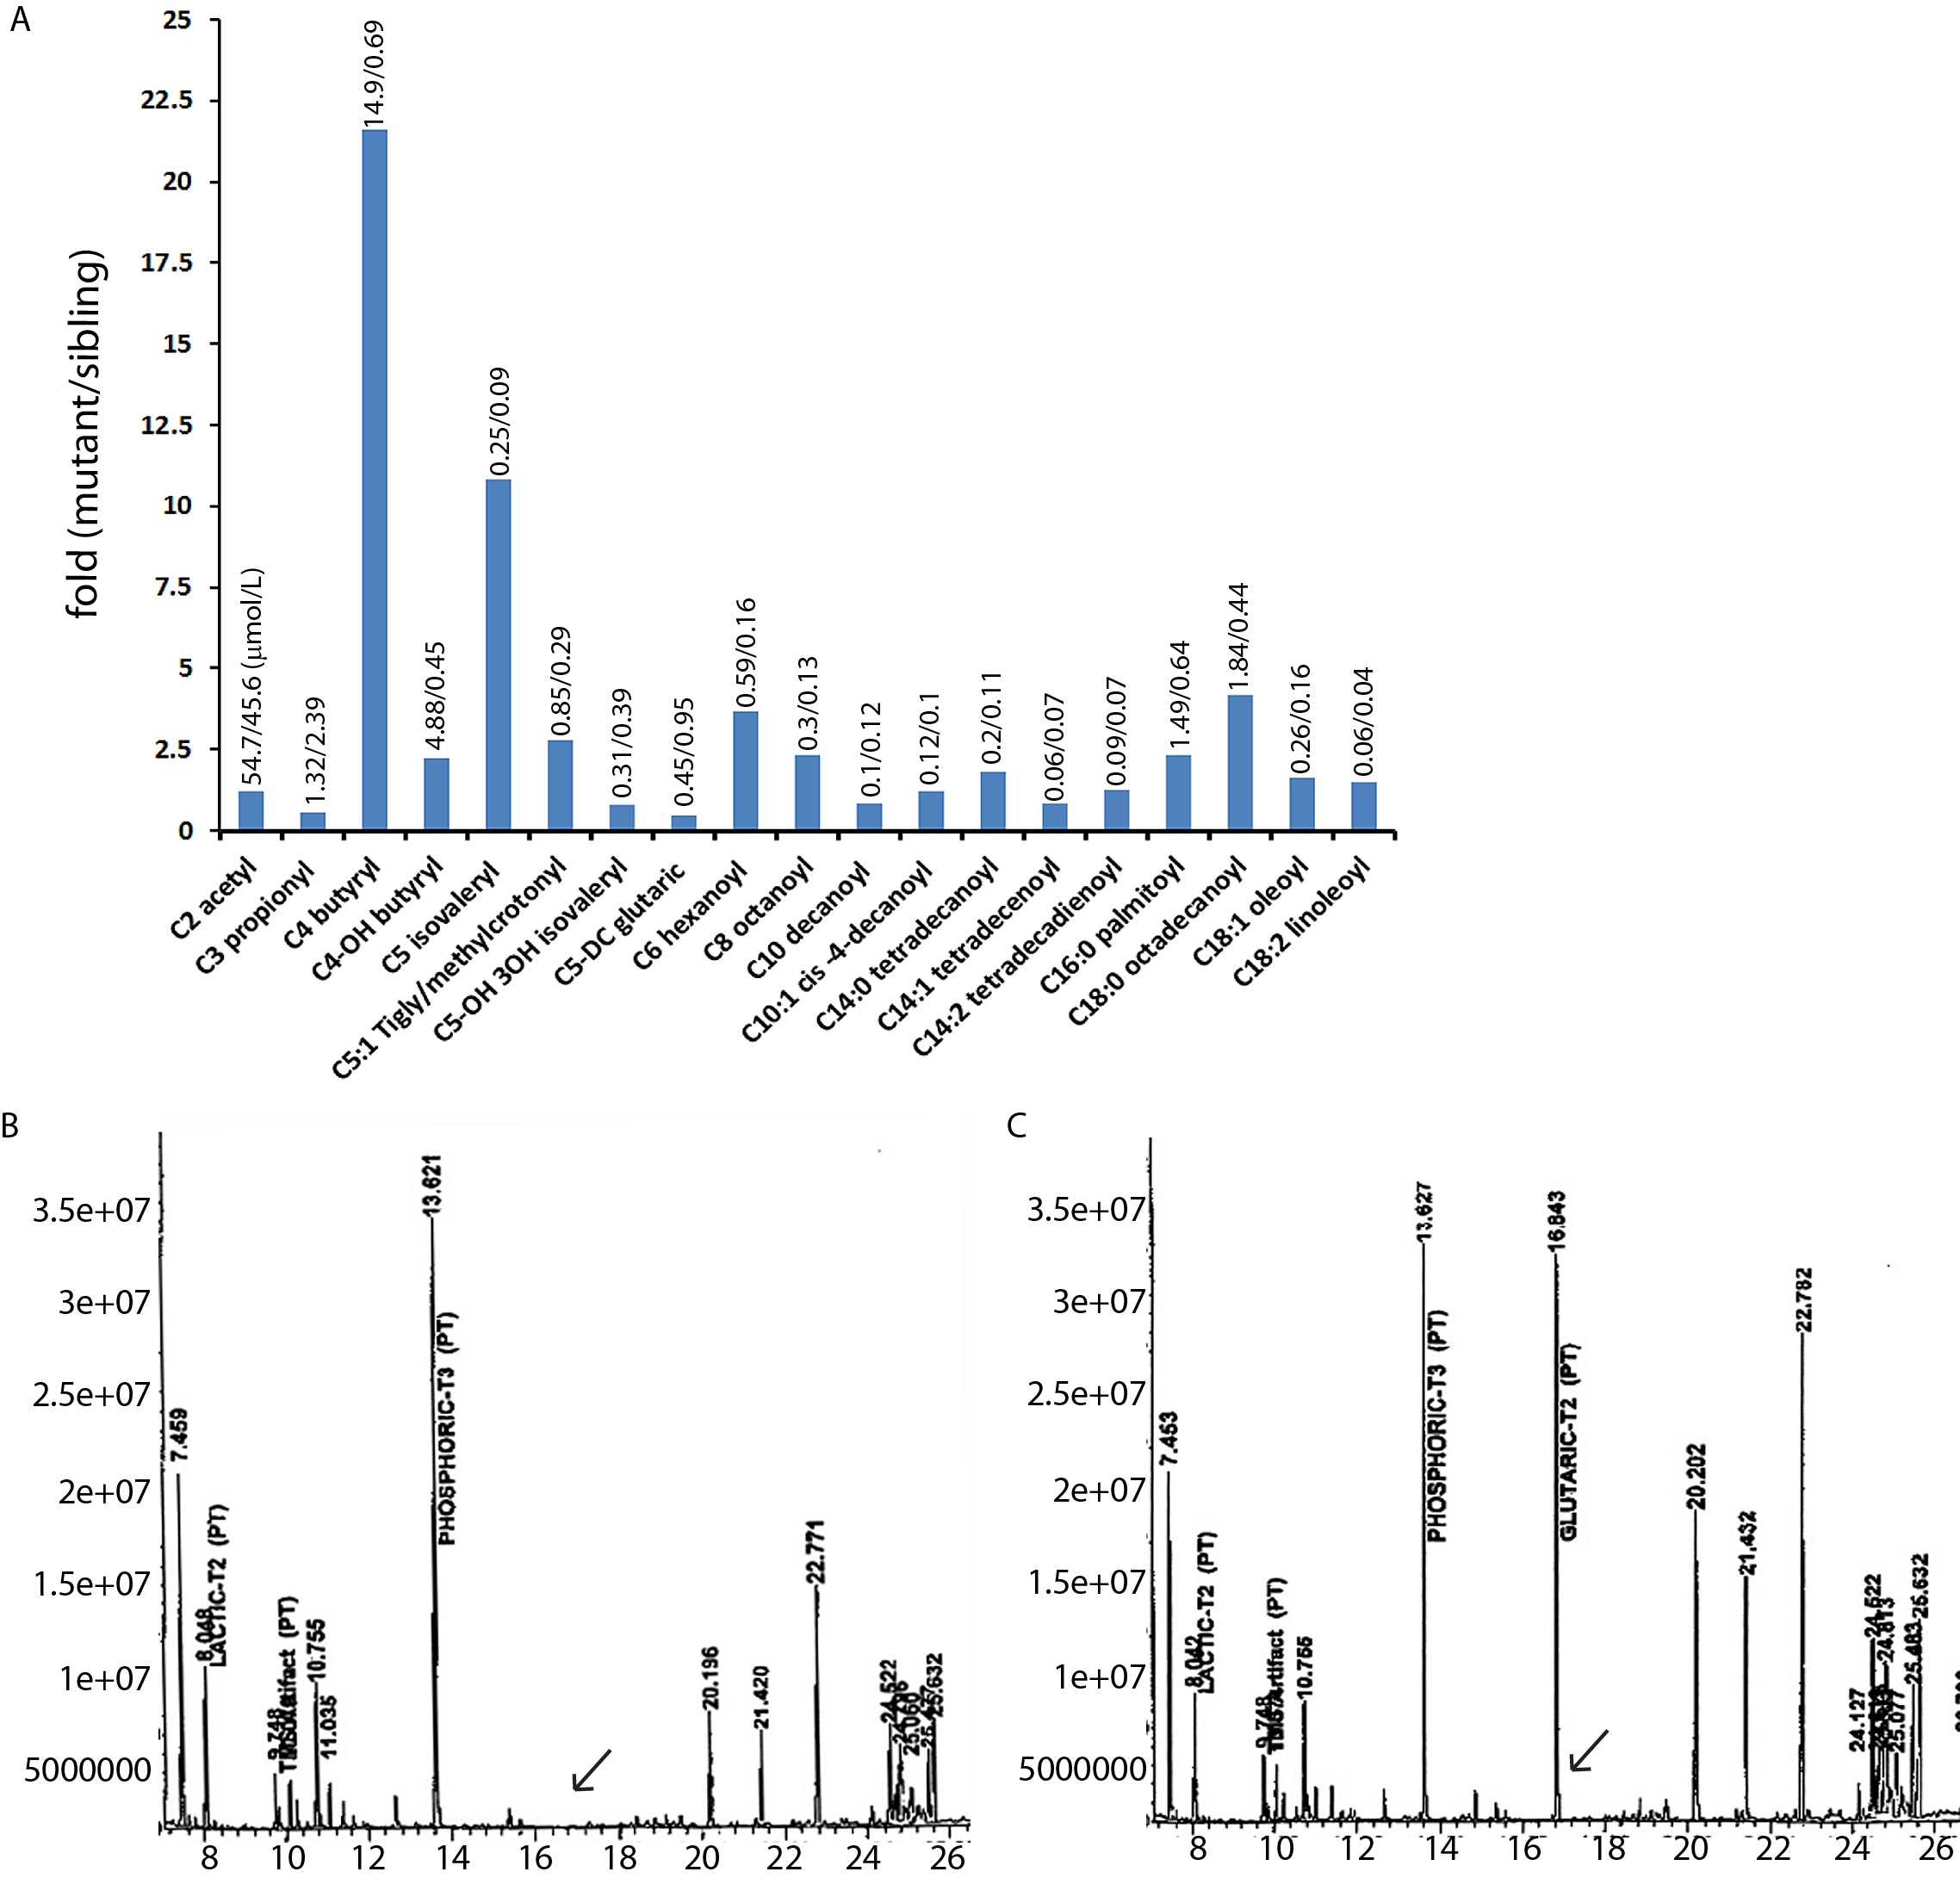
Fig. S2
Abnormal acylcarnitine and organic acids in dxavu463 mutant zebrafish. (A) Representative profile from homogenized control siblings and homozygous dxa mutant larvae (9 dpf) using tandem mass spectrometry. The amount of species (µmol) is shown on the top of bars. (B) Organic acid profile from control siblings and (C) dxa mutant (9 dpf) using gas chromatography electron impact mass spectrometric analysis. Arrows indicate glutaric acid. N = 40 for both control siblings and homozygous mutant dxa zebrafish.
Figure Data
Acknowledgments
This image is the copyrighted work of the attributed author or publisher, and
ZFIN has permission only to display this image to its users.
Additional permissions should be obtained from the applicable author or publisher of the image.
Full text @ PLoS Genet.