FIGURE SUMMARY
Title

Fibroblast growth factor receptor 2c signaling is required for intestinal cell differentiation in zebrafish

Authors
Liu, D.W., Tsai, S.M., Lin, B.F., Jiang, Y.J., and Wang, W.P.
Source
Full text @ PLoS One

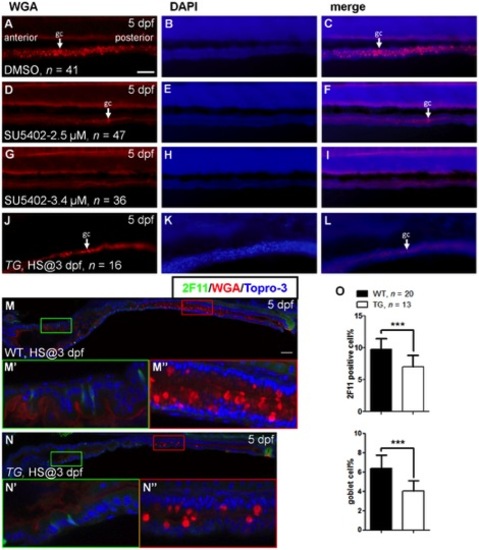
Effects on cell differentiation after inhibition of Fgf signaling.
Five dpf embryos were stained with WGA after incubation in (A–C) DMSO, (D–F) SU5402 (2.5 μM), and (G–I) SU5402 (3.4 μM) at 3 dpf. (J–L) Three dpf Tg(hsp70l:dnfgfr1-EGFP) embryos were heat treated, then stained with WGA at 5 dpf. White arrow indicated the goblet cell (gc). DAPI nuclear counter stain showed the tissue structure. (M) Heat-treated WT embryos were used as controls. (N) Heat shocked transgenic embryos were double labeled with WGA and 2F11 antibody at 5 dpf. (M′ ,N′) The magnified image shows enteroendocrine and (M′ ′,N′ ′) goblet cells. (O) The bar charts show the percentage of 2F11 or WGA positive cells. All images were lateral view with anterior at left and posterior at right. Error bars indicate SD. Scale bars = 50 μm.

EXPRESSION / LABELING:
Antibody:
Fish:
Condition:
Anatomical Term:
Stage: Day 5

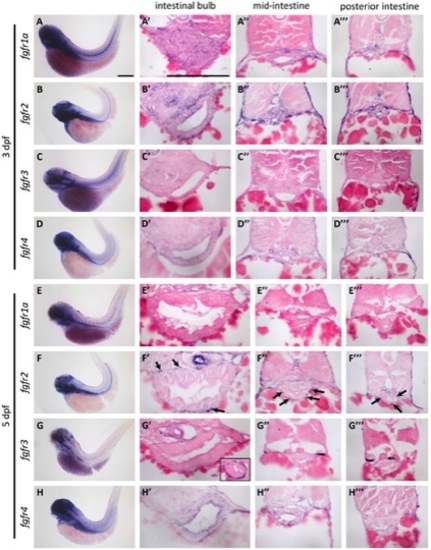
The expression pattern of zebrafish fgfr genes.
The expression of fgfr1a-4 was analyzed by WISH: (A–D) at 3 dpf and (E–H) at 5 dpf. WISH embryos were sectioned and analyzed for expression of fgfr1a-4 in: (A′–H′) the intestinal bulb, (A′′–H′′) the mid-intestine, and (A′′ ′–H′′′) the posterior intestine. Black arrows indicated the fgfr2 expression in mesenchymal cells. Scale bars = 200 μm.

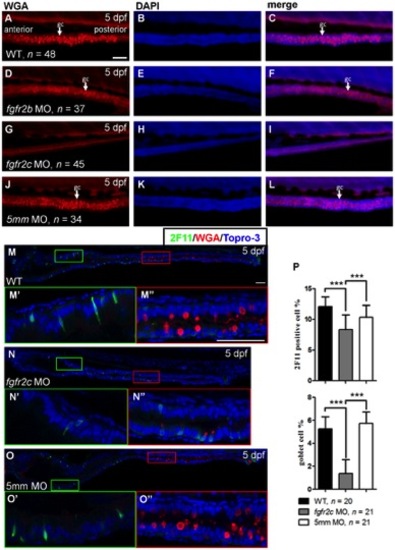
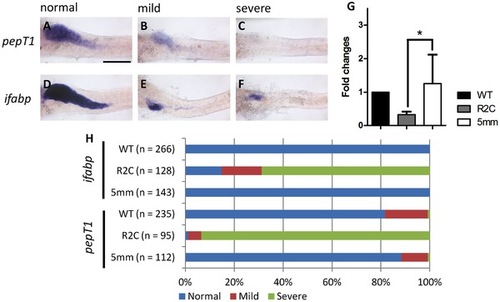
The secretory cell differentiation of fgfr2c morphants.
WGA staining was performed on 5 dpf (A–C) WT embryos, (D–F) fgfr2b, (G–I) fgfr2c, and (J–L) fgfr2c-5 mm morphants. White arrows indicated goblet cell (gc). Double labelling using 2F11 antibody and WGA in (M) WT embryos, (N) fgfr2c morphants, and (O) fgfr2c-5 mm morphants. The magnified image shows (M′–O′) enteroendocrine cells and (M′ ′–O′ ′) goblet cells. Topro-3 was used for nuclear counter staining (blue). (P) The bar charts show the percentages of 2F11 or WGA positive cells. All images were lateral view with anterior at left and posterior at right. Error bars indicate SD. Scale bars = 50 μm.

EXPRESSION / LABELING:
Antibody:
Fish:
Knockdown Reagent:
Anatomical Term:
Stage: Day 5
PHENOTYPE:
Fish:
Knockdown Reagent:
Observed In:
Stage: Day 5

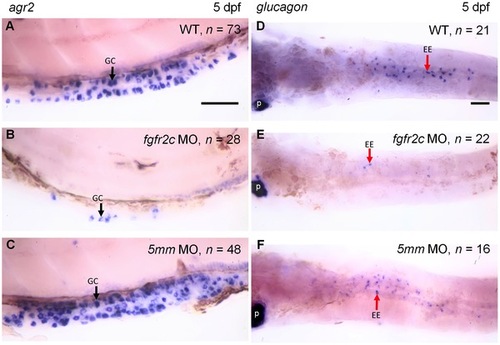
The expression of agr2 and glucagon in fgfr2c morphants.
WISH of agr2 (A–C, lateral view) and glucagon (D–F, ventral view) were used to analyze goblet cell and enteroendocrine differentiation, respectively, in 5 dpf embryos. Black arrows indicated the goblet cells (gc) and red arrows indicated the enteroendocrine cells (ee). p: Pancreatic alpha cells. Scale bars = 50 μm.

EXPRESSION / LABELING:
Genes:
Fish:
Knockdown Reagent:
Anatomical Terms:
Stage: Day 5
PHENOTYPE:
Fish:
Knockdown Reagent:
Observed In:
Stage: Day 5

Absorptive cell differentiation in fgfr2c morphants.
The pepT1 and ifabp WISH were used to analyze enterocyte differentiation in 5 dpf embryos. Three different signal levels were classified as (A,D) normal, (B,E) mild, and (C,F) severe. (G) qPCR analysis of the pepT1 expression level in the fgfr2c morphants and control embryos. Data were normalized with β-actin1 and expressed as fold-induction relative to wild type embryos. Error bars indicate SD. *indicates P<0.05. (H) The bar charts show the percentages of three expression levels of these two genes in WT embryos, and fgfr2c and fgfr2c-5 mm morphants. Scale bar = 200 μm.

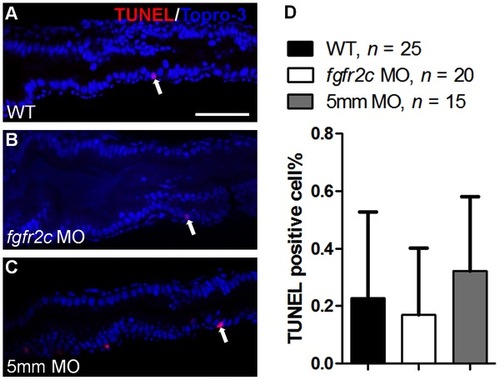
Cell death in fgfr2c morphants. TUNEL assay was performed on (A) WT embryos, (B) fgfr2c morphants, and (C) fgfr2c-5 mm morphants at 5 dpf. TUNEL-positive cells (red) were detected in developing gut (indicated by white arrows). Topro-3 was used for nuclear counter staining (blue). (D) The bar charts show the percentages of TUNEL-positive cells in WT embryos, and fgfr2c and fgfr2c-5 mm morphants. Error bars indicate SD. Scale bar = 50 μm.

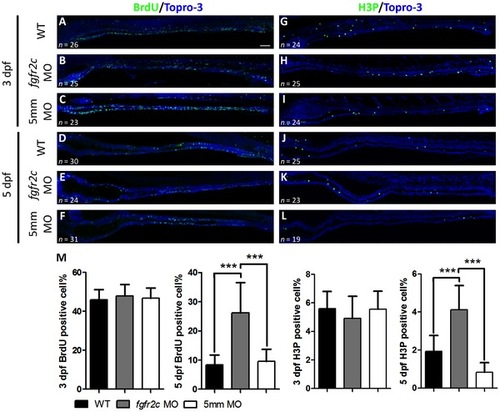
Cell proliferation in fgfr2c morphants.
The S-phase proliferating cells of WT, fgfr2c, and fgfr2c-5 mm morphants were labeled with BrdU at (A–C) 3 dpf and (D–F) 5 dpf. H3P antibody was used to label M-phase cells at (G–I) 3 dpf and (J–L) 5 dpf. (M) Topro-3 was used for nuclear counter staining (blue). The bar charts show the percentages of proliferating cells. Error bars indicate SD. Scale bar = 50 μm.

EXPRESSION / LABELING:
Antibody:
Fish:
Knockdown Reagent:
Anatomical Term:
Stage Range: Protruding-mouth to Day 5
PHENOTYPE:
Fish:
Knockdown Reagent:
Observed In:
Stage: Day 5

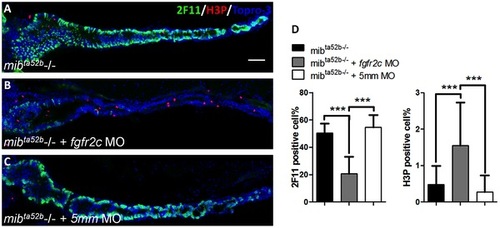
The secretory cell differentiation of mibta52b mutants after injection with fgfr2c morpholino.
The 2F11 (green) and H3P (red) antibodies were used to label the secretory and proliferating cells respectively, in (A) mibta52b mutant, (B) mutant injected with fgfr2c morpholino, and (C) mutant injected with fgfr2c-5 mm morpholino at 5 dpf. Topro-3 was used for nuclear counter staining (blue). (D) The bar charts show the percentages of secretory and proliferating cells. Error bars indicate SD. Scale bar = 50 μm.

EXPRESSION / LABELING:
Antibodies:
Fish:
Knockdown Reagent:
Anatomical Terms:
Stage: Day 5

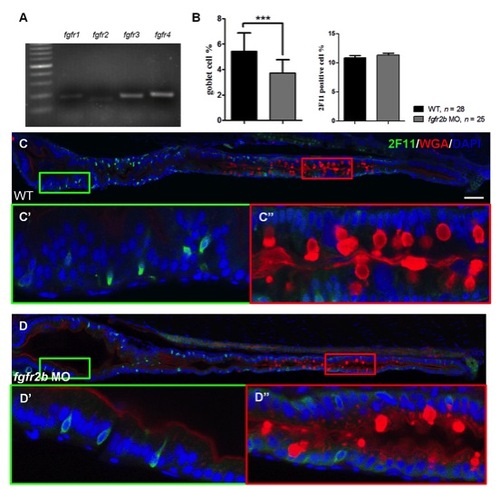
The expression of fgfrs and the secretory cell differentiation of fgfr2b morphants. (A) fgfr1a, fgfr2, fgfr3 and fgfr4 gene were analyzed in 5 dpf zebrafish gut tissue by RT-PCR. (C) WT embryos and (D) fgfr2b morphants were double labeled using 2F11 antibody and WGA. The magnified image shows (C′–D′) enteroendocrine cells and (C′′–D′′) goblet cells. DAPI was used for nuclear counter staining (blue). (B) The bar charts show the percentages of 2F11 and WGA positive cells. Error bars indicate SD. Scale bar = 50 μm.

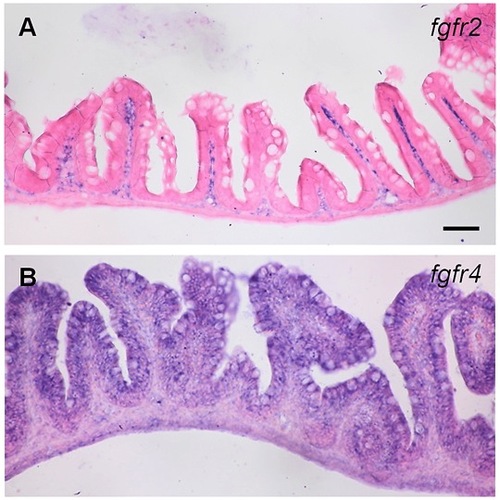
The expression of fgfr2 and fgfr4 in adult zebrafish intestine. Section in situ hybridization was used to analyze the expression of fgfr2 and fgfr4 genes. (A) fgfr2 was detected in the lamina propria, and (B) fgfr4 was expressed mainly in the epithelial layer of the intestine. Scale bar = 50 μm.

EXPRESSION / LABELING:
Genes:
Fish:
Anatomical Terms:
Stage: Adult
Acknowledgments
This image is the copyrighted work of the attributed author or publisher, and ZFIN has permission only to display this image to its users. Additional permissions should be obtained from the applicable author or publisher of the image. Full text @ PLoS One