
Image
|
Figure Caption
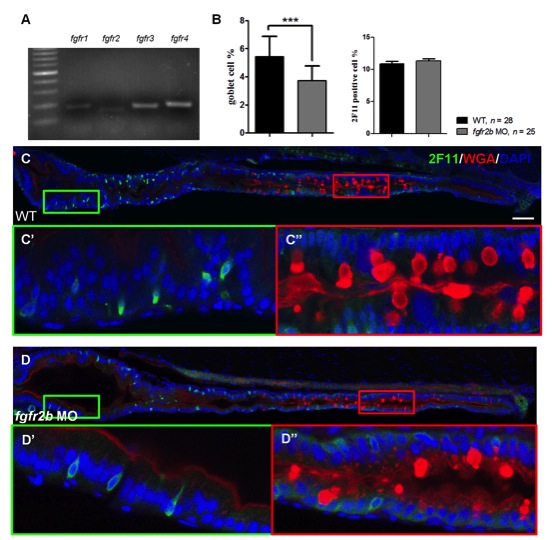
Fig. S1 The expression of fgfrs and the secretory cell differentiation of fgfr2b morphants. (A) fgfr1a, fgfr2, fgfr3 and fgfr4 gene were analyzed in 5 dpf zebrafish gut tissue by RT-PCR. (C) WT embryos and (D) fgfr2b morphants were double labeled using 2F11 antibody and WGA. The magnified image shows (C′–D′) enteroendocrine cells and (C′′–D′′) goblet cells. DAPI was used for nuclear counter staining (blue). (B) The bar charts show the percentages of 2F11 and WGA positive cells. Error bars indicate SD. Scale bar = 50 μm.
Acknowledgments
This image is the copyrighted work of the attributed author or publisher, and
ZFIN has permission only to display this image to its users.
Additional permissions should be obtained from the applicable author or publisher of the image.
Full text @ PLoS One