
Image
|
Figure Caption
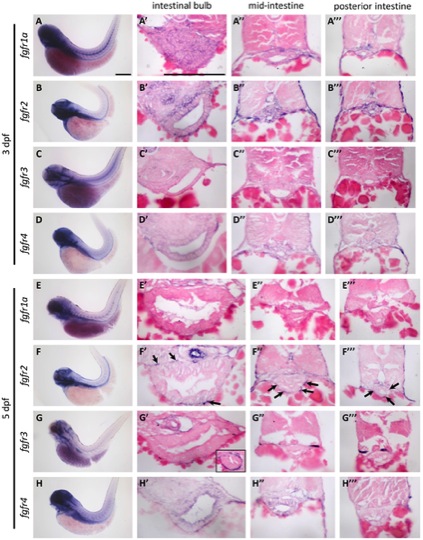
Fig. 2
The expression pattern of zebrafish fgfr genes.
The expression of fgfr1a-4 was analyzed by WISH: (A–D) at 3 dpf and (E–H) at 5 dpf. WISH embryos were sectioned and analyzed for expression of fgfr1a-4 in: (A′–H′) the intestinal bulb, (A′′–H′′) the mid-intestine, and (A′′ ′–H′′′) the posterior intestine. Black arrows indicated the fgfr2 expression in mesenchymal cells. Scale bars = 200 μm.
Figure Data
Acknowledgments
This image is the copyrighted work of the attributed author or publisher, and
ZFIN has permission only to display this image to its users.
Additional permissions should be obtained from the applicable author or publisher of the image.
Full text @ PLoS One