
Image
|
Figure Caption
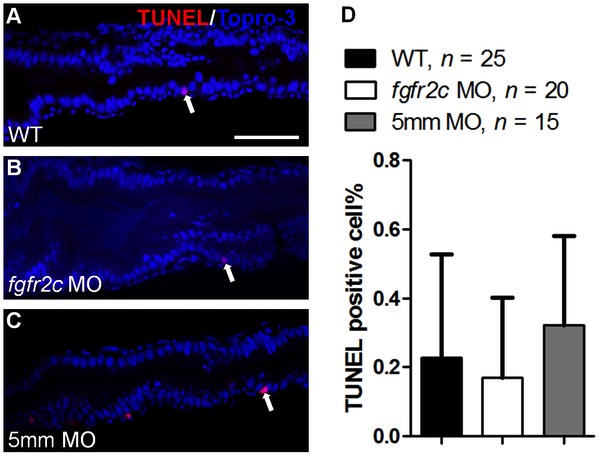
Fig. 6 Cell death in fgfr2c morphants. TUNEL assay was performed on (A) WT embryos, (B) fgfr2c morphants, and (C) fgfr2c-5 mm morphants at 5 dpf. TUNEL-positive cells (red) were detected in developing gut (indicated by white arrows). Topro-3 was used for nuclear counter staining (blue). (D) The bar charts show the percentages of TUNEL-positive cells in WT embryos, and fgfr2c and fgfr2c-5 mm morphants. Error bars indicate SD. Scale bar = 50 μm.
Acknowledgments
This image is the copyrighted work of the attributed author or publisher, and
ZFIN has permission only to display this image to its users.
Additional permissions should be obtained from the applicable author or publisher of the image.
Full text @ PLoS One