
- Title
-
Planar cell polarity signalling regulates cell adhesion properties in progenitors of the zebrafish laterality organ
- Authors
- Oteiza, P., Köppen, M., Krieg, M., Pulgar, E., Farias, C., Melo, C., Preibisch, S., Müller, D., Tada, M., Hartel, S., Heisenberg, C.P., and Concha, M.L.
- Source
- Full text @ Development
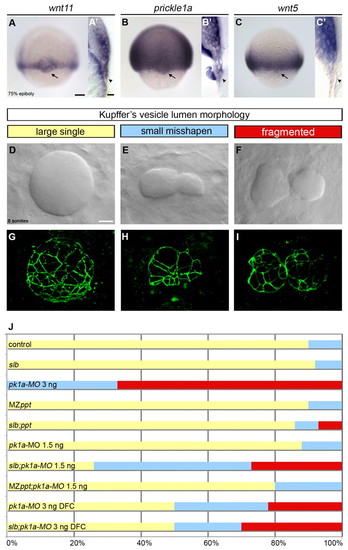
The PCP signalling components wnt11 and prickle1a are expressed in the DFCs and control KV morphogenesis. (A-C′) Expression of wnt11, pk1a and wnt5 in wild-type zebrafish embryos at 75% epiboly as revealed by wholemount in situ hybridisation. Arrows in dorsal views (A,B,C) and arrowheads in sagittal sections (A2,B2,C2) point to the dorsal forerunner cell (DFC) expression domain. (D-I) Kuppfer′s vesicle (KV) lumen morphologies at the 8- to 10-somite stage in wild-type (D,G) and wnt11- and pk1a-defective (E,F,H,I) embryos. (D-F) DIC microscopy views of KV in living embryos. (G-I) Three-dimensional projections of confocal stacks through the entire KV stained with anti-ZO-1 antibody, outlining lumen shape. (J) Horizontal bar chart of the relative frequency of the three main KV morphological phenotypes (large single lumen, yellow; small mis-shapen lumen, blue; fragmented lumen, red) scored in different experimental conditions: control (wild-type untreated, n=21); slb [wnt11 (silberblick) mutants, n=12]; pk1a-MO 3 ng (wild-type injected with 3 ng of pk1a-MO at the 1-cell stage, n=9); MZppt [maternal zygotic wnt5 (pipetail) mutants, n=10]; slb;ppt (wnt11;slb and wnt5;ppt double mutants, n=14); pk1a-MO 1.5 ng (wild-type injected with 1.5 ng of pk1a-MO at the 1-cell stage, n=8); slb;pk1a-MO 1.5 ng (slb mutants injected with 1.5 ng of pk1a-MO at the 1-cell stage, n=19); MZppt;pk1a-MO 1.5 ng (MZppt injected with 1.5 ng of pk1a-MO at the 1-cell stage, n=10); pk1a-MO 3 ng DFC [abrogation of pk1a in wild-type DFCs by injection of 3 ng of pk1a-MO in the yolk syncitial layer (YSL) at mid-blastula stages, n=18]; and slb;pk1a-MO 3 ng DFC (abrogation of pk1a in slb DFCs by injection of 3 ng of pk1a-MO in the YSL at midblastula stages, n=10). Scale bars: 20 μm. EXPRESSION / LABELING:
PHENOTYPE:
|
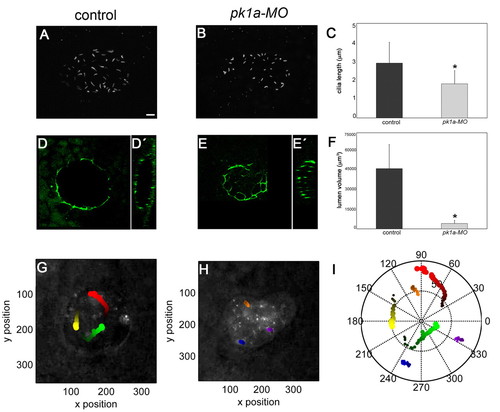
PCP signalling regulates cilia length, lumen volume and Nodal flow in the KV. (A-C) Comparison of cilia length of control and pk1a-MO-injected 8-somite stage zebrafish embryos. z-projections of a dorsal confocal stack through the KV of a control (A) and a morphant (B) embryo stained with an anti-acetylated α-tubulin antibody reveal a more unevenly shaped lumen and shorter cilia in the morphant. Quantitative analysis of multiple embryos (C) reveals significantly shorter cilia in pk1a-MO embryos compared with controls (mean ± s.d.; n=5 control embryos and 3 morphants; *, P<0.05, Student′s t-test). (D-E′) Anti-ZO-1 staining of the KV in control and pk1a-MO-injected embryos. Single dorsal focal planes at the centre of the vesicle (D,E) and sagittal views (D′,E′) are shown. (F) KV lumen volume is reduced in pk1a-MO embryos compared with controls [mean ± s.d.; n=10 control embryos and 5 morphants; *, P<0.05, Student′s t-test (KaleidaGraph, SynergySoftware)]. Approximate volume was determined based on the three main axes of the ellipsoid lumen. For fragmented lumina, volume was computed as the sum. (G-I) Nodal flow is strongly reduced in pk1a-MO embryos. Colour-coded tracks of fluorescent beads injected into the KV of a control (G) and a pk1a-MO (H) embryo. The bead trajectories shown in G and H are plotted in I. Scale bars: 20 μm. PHENOTYPE:
|
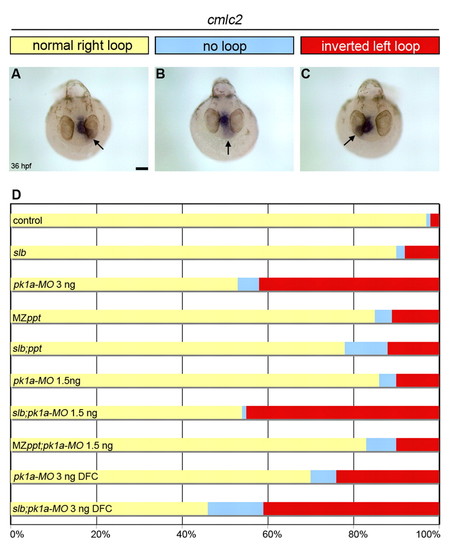
PCP signalling regulates heart loop laterality in zebrafish. (A-C) Top view of 36 hpf pk1aMO-injected embryos showing expression of cardiac myosin light chain 2 (cmlc2) in the heart tube by wholemount in situ hybridisation. Arrows indicate the orientation of heart looping: normal loop to the right (A), absent loop (B) and inverted loop to the left (C). (D) Horizontal bar chart of the relative frequency of heart loop orientation (right loop, yellow; no loop, blue; left loop, red) scored in different experimental conditions (same conditions as in Fig. 1): control (n=122); slb (n=12); pk1a-MO 3 ng (n=137); MZppt (n=122); slb;ppt (n=50); pk1a-MO 1.5 ng (n=94); slb;pk1a-MO 1.5 ng (n=170); MZppt;pk1aMO 1.5 ng (n=60); pk1a-MO 3 ng DFC (n=46); and slb;pk1a-MO 4 ng DFC (n=56). Scale bar: 20 μm. |
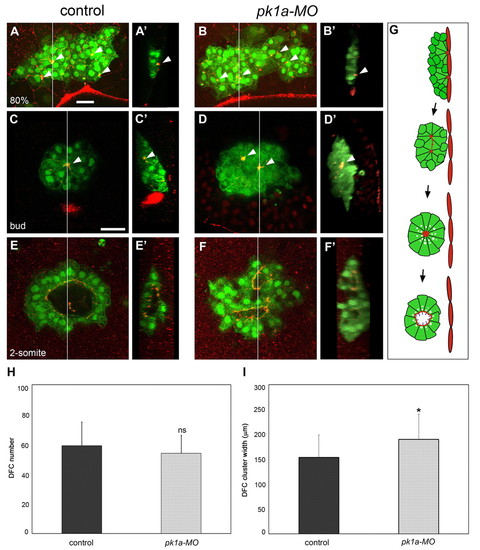
Pk1a is required for DFC cluster organisation and KV lumen morphogenesis. (A-B′) DFC cluster organisation at 80% epiboly in control and pk1a-MO-injected zebrafish embryos expressing sox17::GFP and immunostained with anti-ZO-1 antibody. Dorsal projections of confocal z-stacks (A,B) and sagittal views at the position of the line (A′,B′; embryo surface to the right) are shown. Animal pole is to the top. In a control embryo, DFCs form a compact cluster that is in contact with the interior surface of the enveloping layer (EVL) close to the margin. Anti-ZO-1 staining reveals distinct accumulations of ZO-1 that mark contact points (arrowheads) between DFCs and the overlying EVL (A,A′). In a pk1a-MO embryo, the DFC cluster is wider and more irregularly shaped than in the control. ZO-1-rich attachment points (arrowheads), similar to those of the control, are observed (B,B′). (C-F′) DFC cluster organisation at bud and 2-somite stages in control and pk1a-MO embryos expressing sox17::GFP and immunostained with anti-ZO-1 antibody. Single focal planes at the centre of the cluster (C-F) and sagittal views of the cluster at the position of the line (C′-F′; embryo surface to the right) are shown. Anterior is to the top. In a bud-stage control embryo, a single major focal point enriched for ZO-1 (arrowheads) is seen at the centre of the cluster (C,C′). The cluster is disconnected from the overlying EVL (C′). In a bud-stage pk1a-MO embryo, two major focal points are observed within the cluster (D,D′; arrowheads). In a 2-somite stage control embryo, a single large lumen is seen in the interior of the DFC cluster and is delineated by anti-ZO-1 signal (E,E′). A 2-somite stage pk1a-MO embryo shows two distinct lumina (F,F′). (G) Schematic representation of KV lumen formation. (H) Graphic representation of DFC number (mean ± s.d.; n=24 control and n=22 pk1a-MO embryos; P<0.01). (I) Graphic representation of DFC cluster width (mean ± s.d.; n=29 control and 29 pk1a-MO embryos; *, P<0.01). ns, not significant. Scale bars: 30 μm. PHENOTYPE:
|
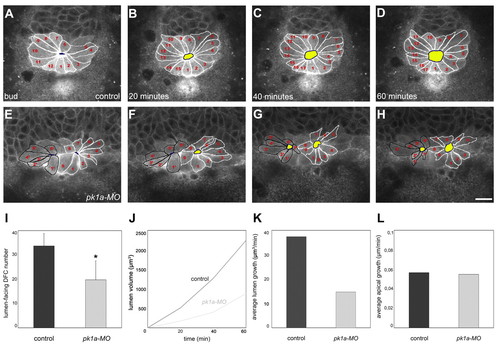
Pk1a regulates KV lumen formation and expansion. (A-H) Live imaging of KV lumen formation in control and pk1a-MO zebrafish embryos coexpressing sox17::GFP and β-actin::HRAS-EGFP. Single focal planes at the centre of the DFC cluster are shown, beginning at the tailbud stage and followed every 20 minutes as indicated. Anterior is to the top. Each lumen-forming DFC is outlined and numbered. DFC apical sides are outlined in blue and the lumen is highlighted in yellow. (I) Graphic representation of lumen-forming DFC number in control and pk1a-MO embryos (mean ± s.d.; n=6 control and 7 pk1a-MO embryos; *, P<0.01, Student′s t-test) obtained from nuclei-stained Tg(sox17::GFP) embryos. (J) Graphic representation of lumen expansion during early KV formation as measured in Tg(sox17::GFP;β-actin::HRAS-EGFP) embryos. Approximate volume for control (n=2 movies) and pk1a-MO (n=2 movies) embryos was determined based on the three main axes of the ellipsoid lumen at different time-points. The start point was set at lumen opening. For fragmented lumina, volume was computed as the sum. (K) Graphic representation of the average rate of lumen growth (final volume/total time) based on the data presented in J. (L) Graphic representation of lumen-facing DFC average rate of apical growth [(final lumen circumference/final number of lumen-forming DFCs)/total time] measured in Tg(sox17::GFP;β-actin::HRAS-EGFP) embryos. Scale bar: 20 μm. PHENOTYPE:
|
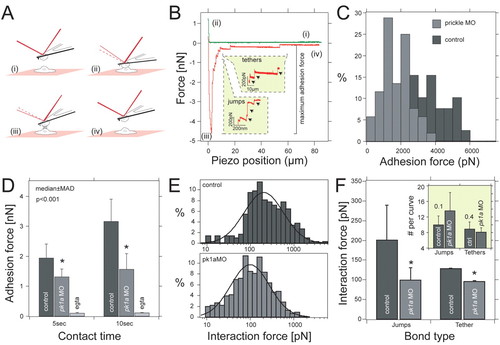
Pk1a regulates cell adhesion properties between DFCs. (A) Schematic outline of the single-cell force spectroscopy. Two cells are approached (i) until they come into contact (ii) to establish adhesion (i,ii). After the preset contact time, both cells are withdrawn (iii) until they are completely separate again (iv). (B) Representative force-distance curves taken from control DFCs. Unbinding events are separated into `jumps′ and `tethers′. Both are shown in separate insets. For data analysis, we quantified maximum adhesion force, jump and tether force. (C) Frequency distribution of adhesion forces recorded from control (nH30 cells; dark grey) and pk1a-MO (nH35 cells; light grey) DFCs for 10 seconds contact time. (D) Median ± median absolute deviation (m.a.d.) of the maximum adhesion force for control and pk1a-MO DFCs in control and calcium suppression conditions (EGTA). *, P<0.01, Mann-Whitney U-test. (E) Frequency distribution of jumps quantified from force curves taken with control (n=296 events; top) and pk1a-MO (n=469 events; bottom) cells. Distributions were fitted to Equation 1 (see Materials and methods) to extract the average force step size. (F) Mean force and standard error for jumps and tethers extracted for 10 seconds contact time measured in control and pk1a-MO DFCs. *, P<0.001, Mann-Whitney U-test. Inset shows the average number of jumps and tethers extracted from a log-normal distribution. PHENOTYPE:
|
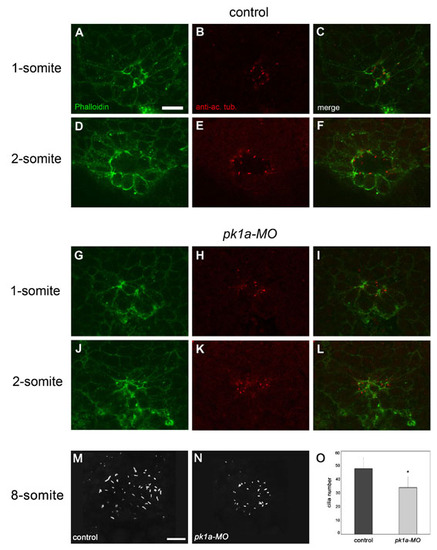
Cilia formation is impaired in pk1a-MO embryos. Confocal images of the dorsal forerunner cell (DFC) cluster double-labelled with the F-actin marker Phalloidin (green) and an anti-acetylated α-tubulin antibody (red). Single dorsal focal planes (individual and merged channels) are shown. (A-F) Control embryos. One-somite stage; DFCs are positioned around a single small lumen that is delineated by strong Phalloidin labelling (A,C) and short acetylated α-Tubulin-rich cilia (B,C). Two-somite stage; a larger lumen and slightly longer cilia are present (D-F). (G-L) Embryos injected with pk1a-MO. One-somite stage; two Phalloidin-rich focal points but no clear lumen are present in the DFC cluster (G,I). Dot-like acetylated α-Tubulin label indicates the initiation of cilia at the position of the focal points (H,I). Two-somite stage; a small mis-shapen lumen strongly labelled by Phalloidin is present (J,L). The lumen is lined with abnormally short cilia (K,L). (M,N) 3D projections of anti-α-Tubulin staining of the Kuppfer′s vesicle (KV) in an 8-somite stage control (M) and pk1a-MO-injected (N) embryos. (O) Cilia number is reduced in pk1a-MO embryos compared with controls (mean ± SD; n=7 control embryos and 7 morphants). Scale bars: 20 μm. |
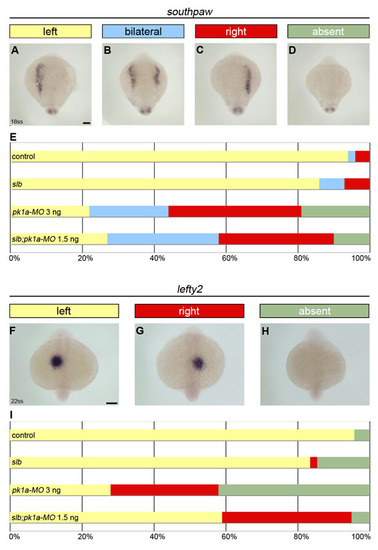
PCP signalling regulates the laterality of Nodal asymmetric gene expression in zebrafish. (A-D) Expression of the Nodal-related gene southpaw revealed by in situ hybridisation in 18-somite stage slb mutant embryos injected with 1.5 ng of pk1a-MO. (E) Horizontal bar chart showing the relative frequency of southpaw asymmetric gene expression (left, yellow; bilateral, light blue; right, red; absent, green) scored in different experimental conditions: control (wild-type untreated, n=85); slbwnt11 (silberblick) mutants, n=146; pk1a-MO 3 ng (wild-type injected with 3 ng of pk1a-MO at 1-cell stage, n=27); slb;pk1a-MO 1.5 ng (slb mutants injected with 1.5 ng of pk1a-MO at 1-cell stage, n=96). (F-H) Expression of the Nodal signalling component lefty2 revealed by in situ hybridisation in 22-somite stage slb mutant embryos injected with 1.5 ng of pk1a-MO. (I) Horizontal bar chart showing the relative frequency of lefty2 asymmetric gene expression (left, yellow; right, red; absent, green) scored in different experimental conditions: control (n=43); slb (n=60); pk1a-MO 3 ng (n=50); and slb;pk1a-MO 1.5 ng (n=41). Scale bars: 100 μm. |
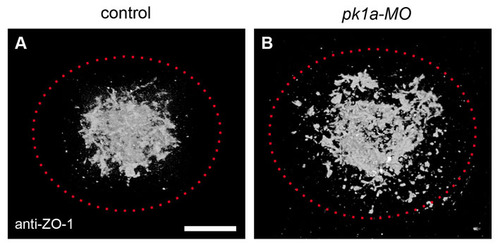
ZO-1-rich focal points are more widely distributed in pk1a-MO embryos. Average 3D pattern of anti-ZO-1 signal from several embryos at the 1-somite stage, demonstrating distribution of apical focal points at the interior of the DFC cluster (see Materials and methods). The dotted red line marks the approximate extent of the DFC cluster based on mean width and height. In control embryos, anti-ZO-1 staining forms a compact cluster at the centre of the DFC group (A). pk1a-MO embryos show a more widely spaced and scattered distribution (B). Scale bar: 20 μm. |
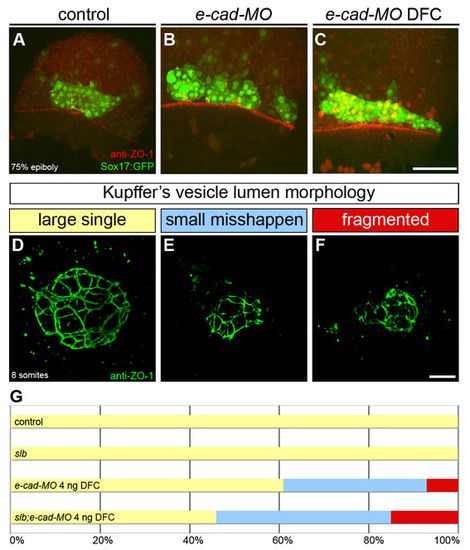
E-cadherin regulates DFC cluster organisation and KV morphogenesis. (A-C) DFC cluster organisation at 80% epiboly in control, e-cad-MO and e-cad-MO DFC injected embryos expressing Sox17::GFP and immunostained with the anti-ZO-1 antibody. Dorsal projections of confocal Z-stacks are shown. Animal pole is to the top. (A) In a control embryo, DFCs appear as a compact cell cluster. (B) In an e-cad-MO embryo, the DFC cluster appears wider and irregularly shaped. (C) When targeted to the DFCs, e-cad-MO also induces a disorganisation of the DFC cluster. (D-F) Z-projections of anti-ZO-1 immunolabeled KVs in wild-type (D) and e-cad-MO DFC injected embryos (E,F). (G) Horizontal bar chart of the relative frequency of the three main KV morphological phenotypes, as described in Fig. 1 (large single lumen, yellow; small misshapen, blue; fragmented, red) scored in different experimental conditions: control (n=4); slb (n=3); e-cad-MO 4 ng DFC (n=13); and slb;e-cad-MO 4 ng DFC (n=13). Scale bars: 20 μm. |