
Image
|
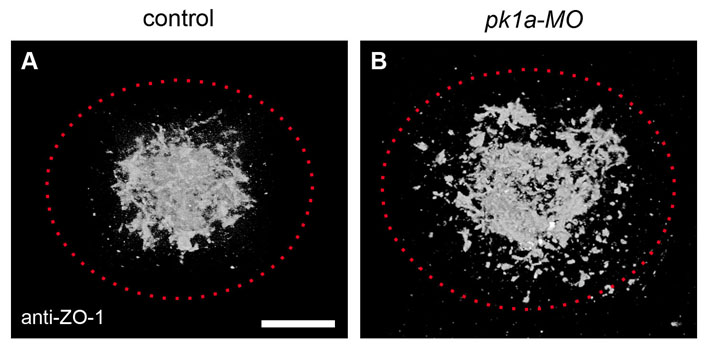
Figure Caption
Fig. S3 ZO-1-rich focal points are more widely distributed in pk1a-MO embryos. Average 3D pattern of anti-ZO-1 signal from several embryos at the 1-somite stage, demonstrating distribution of apical focal points at the interior of the DFC cluster (see Materials and methods). The dotted red line marks the approximate extent of the DFC cluster based on mean width and height. In control embryos, anti-ZO-1 staining forms a compact cluster at the centre of the DFC group (A). pk1a-MO embryos show a more widely spaced and scattered distribution (B). Scale bar: 20 μm.
Acknowledgments
This image is the copyrighted work of the attributed author or publisher, and
ZFIN has permission only to display this image to its users.
Additional permissions should be obtained from the applicable author or publisher of the image.
Full text @ Development