
|
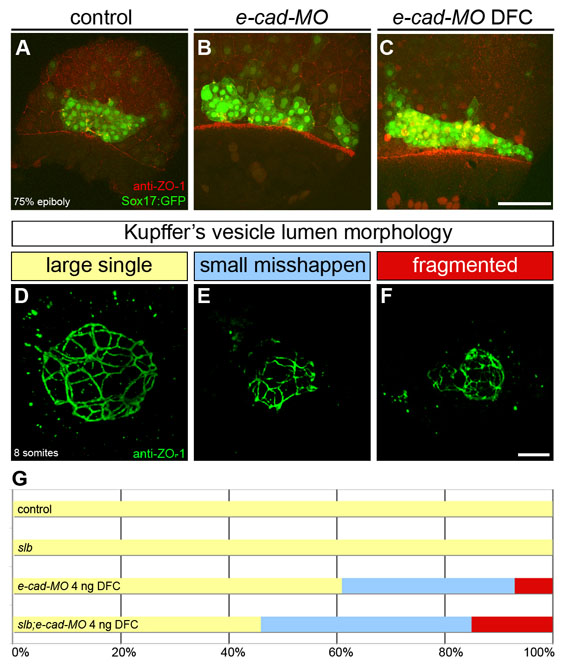
Fig. S5 E-cadherin regulates DFC cluster organisation and KV morphogenesis. (A-C) DFC cluster organisation at 80% epiboly in control, e-cad-MO and e-cad-MO DFC injected embryos expressing Sox17::GFP and immunostained with the anti-ZO-1 antibody. Dorsal projections of confocal Z-stacks are shown. Animal pole is to the top. (A) In a control embryo, DFCs appear as a compact cell cluster. (B) In an e-cad-MO embryo, the DFC cluster appears wider and irregularly shaped. (C) When targeted to the DFCs, e-cad-MO also induces a disorganisation of the DFC cluster. (D-F) Z-projections of anti-ZO-1 immunolabeled KVs in wild-type (D) and e-cad-MO DFC injected embryos (E,F). (G) Horizontal bar chart of the relative frequency of the three main KV morphological phenotypes, as described in Fig. 1 (large single lumen, yellow; small misshapen, blue; fragmented, red) scored in different experimental conditions: control (n=4); slb (n=3); e-cad-MO 4 ng DFC (n=13); and slb;e-cad-MO 4 ng DFC (n=13). Scale bars: 20 μm.