
|
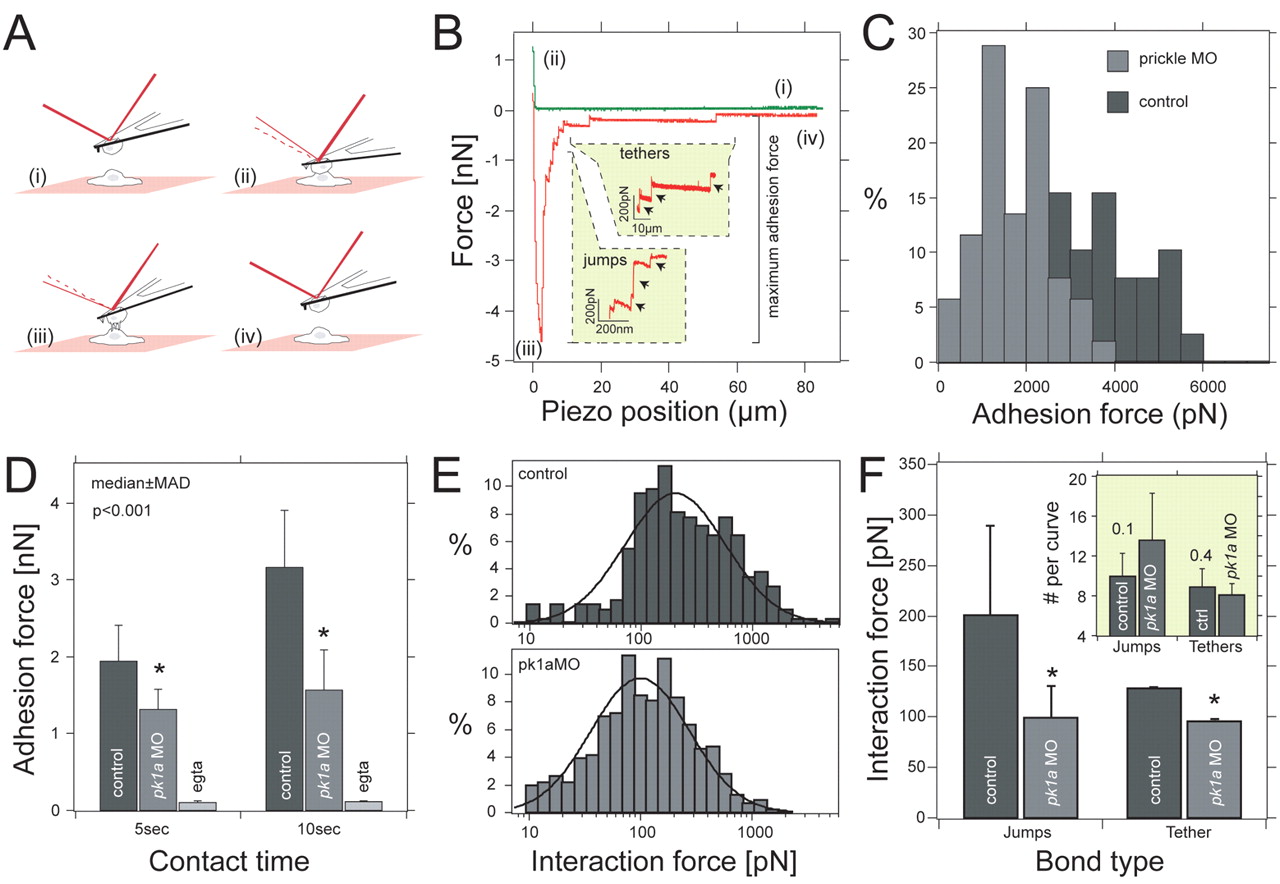
Fig. 6 Pk1a regulates cell adhesion properties between DFCs. (A) Schematic outline of the single-cell force spectroscopy. Two cells are approached (i) until they come into contact (ii) to establish adhesion (i,ii). After the preset contact time, both cells are withdrawn (iii) until they are completely separate again (iv). (B) Representative force-distance curves taken from control DFCs. Unbinding events are separated into `jumps′ and `tethers′. Both are shown in separate insets. For data analysis, we quantified maximum adhesion force, jump and tether force. (C) Frequency distribution of adhesion forces recorded from control (nH30 cells; dark grey) and pk1a-MO (nH35 cells; light grey) DFCs for 10 seconds contact time. (D) Median ± median absolute deviation (m.a.d.) of the maximum adhesion force for control and pk1a-MO DFCs in control and calcium suppression conditions (EGTA). *, P<0.01, Mann-Whitney U-test. (E) Frequency distribution of jumps quantified from force curves taken with control (n=296 events; top) and pk1a-MO (n=469 events; bottom) cells. Distributions were fitted to Equation 1 (see Materials and methods) to extract the average force step size. (F) Mean force and standard error for jumps and tethers extracted for 10 seconds contact time measured in control and pk1a-MO DFCs. *, P<0.001, Mann-Whitney U-test. Inset shows the average number of jumps and tethers extracted from a log-normal distribution.