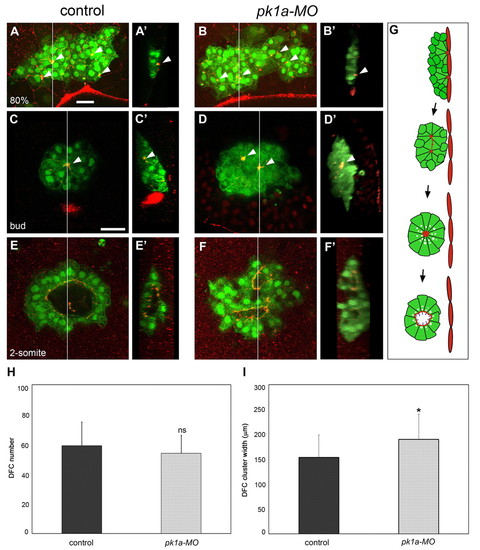
Pk1a is required for DFC cluster organisation and KV lumen morphogenesis. (A-B′) DFC cluster organisation at 80% epiboly in control and pk1a-MO-injected zebrafish embryos expressing sox17::GFP and immunostained with anti-ZO-1 antibody. Dorsal projections of confocal z-stacks (A,B) and sagittal views at the position of the line (A′,B′; embryo surface to the right) are shown. Animal pole is to the top. In a control embryo, DFCs form a compact cluster that is in contact with the interior surface of the enveloping layer (EVL) close to the margin. Anti-ZO-1 staining reveals distinct accumulations of ZO-1 that mark contact points (arrowheads) between DFCs and the overlying EVL (A,A′). In a pk1a-MO embryo, the DFC cluster is wider and more irregularly shaped than in the control. ZO-1-rich attachment points (arrowheads), similar to those of the control, are observed (B,B′). (C-F′) DFC cluster organisation at bud and 2-somite stages in control and pk1a-MO embryos expressing sox17::GFP and immunostained with anti-ZO-1 antibody. Single focal planes at the centre of the cluster (C-F) and sagittal views of the cluster at the position of the line (C′-F′; embryo surface to the right) are shown. Anterior is to the top. In a bud-stage control embryo, a single major focal point enriched for ZO-1 (arrowheads) is seen at the centre of the cluster (C,C′). The cluster is disconnected from the overlying EVL (C′). In a bud-stage pk1a-MO embryo, two major focal points are observed within the cluster (D,D′; arrowheads). In a 2-somite stage control embryo, a single large lumen is seen in the interior of the DFC cluster and is delineated by anti-ZO-1 signal (E,E′). A 2-somite stage pk1a-MO embryo shows two distinct lumina (F,F′). (G) Schematic representation of KV lumen formation. (H) Graphic representation of DFC number (mean ± s.d.; n=24 control and n=22 pk1a-MO embryos; P<0.01). (I) Graphic representation of DFC cluster width (mean ± s.d.; n=29 control and 29 pk1a-MO embryos; *, P<0.01). ns, not significant. Scale bars: 30 μm.
|
