
- Title
-
Vessel and blood specification override cardiac potential in anterior mesoderm
- Authors
- Schoenebeck, J.J., Keegan, B.R., and Yelon, D.
- Source
- Full text @ Dev. Cell
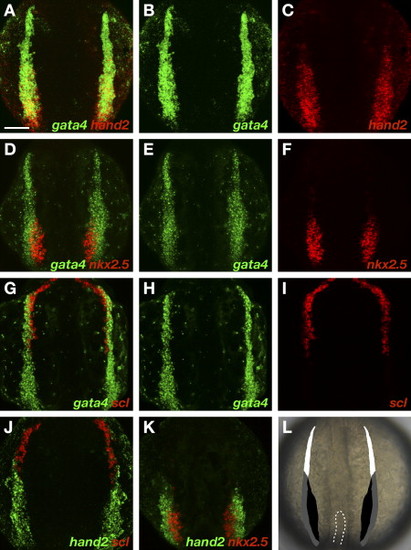
Gene Expression Patterns Divide the ALPM into Three Territories (A–K) Two-color fluorescent in situ hybridization of wild-type embryos at the 7 somite stage, dorsal views, anterior to the top. All images are shown at the same magnification; the scale bar represents 100 μm. (A) Overlay of gata4 (B) and hand2 (C) expression. Expression of hand2 is observed throughout the caudal portion of gata4-expressing ALPM, but is excluded from the rostral ALPM. (D) Overlay of gata4 (E) and nkx2.5 (F) expression. Expression of nkx2.5 is observed within a medial portion of the caudal ALPM, but is excluded from the lateral and rostral ALPM. (G) Overlay of gata4 (H) and scl (I) expression. Expression of scl is observed in the rostral ALPM. (J) Overlay of hand2 (green) and scl (red) expression. Expression patterns of scl and hand2 do not overlap. (K) Overlay of hand2 (green) and nkx2.5 (red) expression. Expression of hand2 extends beyond the lateral limit of nkx2.5 expression. (L) Schematic of 7 somite stage ALPM, superimposed onto a dorsal view of a live embryo; dashes outline the tip of the notochord. Comparison of gene expression patterns defines rostral (white), medial (black), and lateral (gray) ALPM territories. Although ALPM morphology varies slightly during the 6–9 somite stage and between individual embryos, relative patterns of gene expression consistently demarcate these territories. EXPRESSION / LABELING:
|
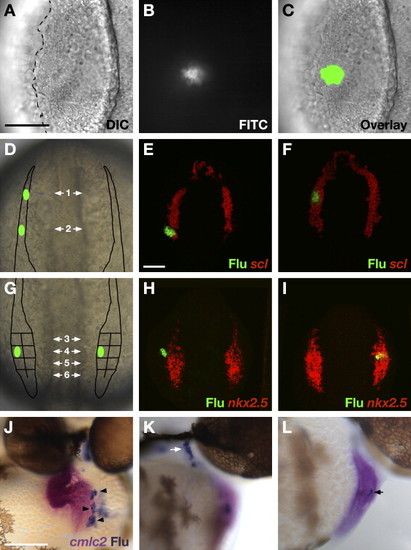
Constructing a Fate Map of ALPM Territories (A–I) Dorsal views, anterior to the top, of wild-type embryos at the 6–9 somite stage. The scale bars represent 100 μm. (A–C) Photoactivation of caged fluorescein labels groups of cells in the ALPM. (A) DIC image of a live embryo. The lateral edge of the ALPM (dashed line) is visible. (B) Fluorescence indicates photoactivation of caged fluorescein. (C) Overlay of DIC and fluorescent images confirms location of labeled cells. In this example, the ∼14 labeled cells reside in the medial ALPM. (D and G) Schematics indicate ALPM regions that were interrogated by fate mapping. (D) Two regions within the rostral ALPM were examined, on both sides of the embryo: a region flanking the forebrain (region 1) and a region flanking the midbrain-hindbrain boundary (region 2). (E and F) Examples of control experiments performed to assess the accuracy of labeling rostral ALPM. Cells were labeled in the regions depicted by green ovals in (D) and immediately processed to compare scl expression (red) relative to uncaged fluorescein (green). (E) Cells labeled in region 2 were located solely within the scl expression domain in 5/9 experiments; in the other four experiments, labeling crossed the posterior border of scl expression and therefore overlapped with hand2-expressing territory. (F) Cells labeled in region 1 were located within the scl expression domain in 8/8 experiments. (G) Eight regions within the caudal ALPM were examined, on both sides of the embryo: four medial regions and four lateral regions are distinguished by their position along the anterior-posterior axis. (H and I) Examples of control experiments performed to assess mediolateral labeling accuracy. Cells were labeled in the regions depicted by green ovals in (D) and immediately processed to compare nkx2.5 expression (red) relative to uncaged fluorescein (green). (H) Cells labeled in lateral regions did not express nkx2.5 (n = 8/9). (I) Conversely, cells labeled in medial regions did express nkx2.5 (n = 6/6). (J–L) Scoring progeny of labeled ALPM cells at 44 hpf. In situ hybridization indicates expression of cmlc2 (magenta) in cardiomyocytes, and immunohistochemistry for uncaged fluorescein (blue) indicates progeny of labeled cells. The scale bar represents 100 μm. (J) Frontal view, dorsal to the top; in this example, labeled cells became ∼30 atrial cardiomyocytes (black arrowheads). (K and L) Lateral views, anterior to the right. (K) In this example, 30–40 labeled cells populated a pharyngeal pouch (white arrow). (L) In this example, 3–4 labeled cells (black arrow) contributed to the ventricular endocardium. EXPRESSION / LABELING:
|
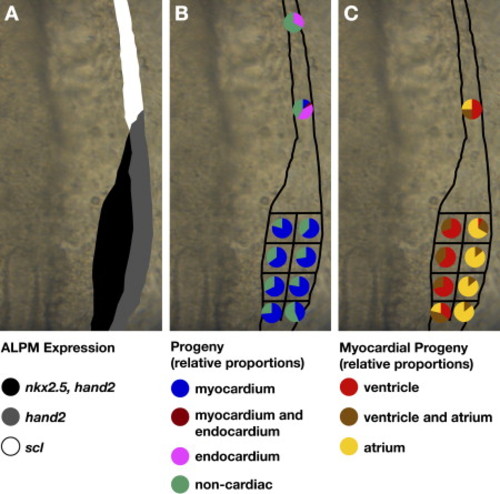
Fate Map of Cardiac Progenitors within ALPM Territories. Schematics depicting the progenitor composition of medial, lateral, and rostral ALPM territories. Dorsal views are of the right side of the ALPM, anterior to the top. (A) Schematic of gene expression patterns that distinguish medial (black), lateral (gray), and rostral (white) ALPM territories, as in Figure 1L. (B) Myocardial progenitors arise from medial and lateral territories and are only rarely detected in rostral territory. In contrast, endocardial progenitors arise from rostral territory. For each region tested, pie charts depict the proportions of experimental embryos exhibiting a particular type of labeled progeny. Colored pie pieces represent embryos that produced labeled myocardial progeny (blue), labeled endocardial progeny (pink), both myocardial and endocardial labeled progeny (maroon), and only noncardiac labeled progeny (green). Data shown are a merger of experiments from the left and right sides of the embryo; our data did not reveal any left-right asymmetry of the fate map. (C) Ventricular and atrial myocardial progenitors appear spatially organized within the caudal ALPM, with ventricular progenitors tending to originate medially and atrial progenitors tending to originate laterally. Pie charts depict the chamber contributions of labeled cells in the subset of experimental embryos containing labeled myocardial progeny. Colored pie pieces represent embryos that produced labeled ventricular cardiomyocytes (red), labeled atrial cardiomyocytes (yellow), and both ventricular and atrial cardiomyocytes (brown). See Table 1 for data reflected in schematics. |
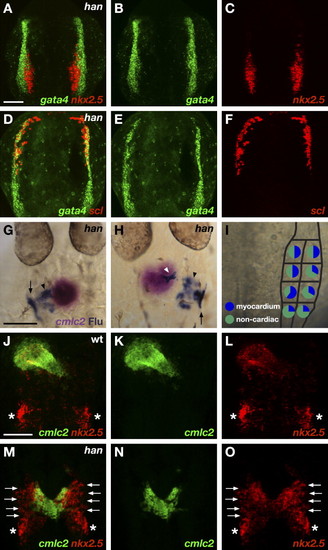
Hand2 Potentiates Myocardial Differentiation (A–F) ALPM territories appear to be established normally in han mutant embryos. Two-color fluorescent in situ hybridization of han mutants at the 7 somite stage, dorsal views, anterior to the top. The scale bar represents 100 μm. (A) Overlay of gata4 (B) and nkx2.5 (C) expression. (D) Overlay of gata4 (E) and scl (F) expression. Expression patterns of gata4, nkx2.5, and scl divide the han mutant ALPM into normally proportioned rostral, medial, and lateral regions. (G–I) Fate map of the caudal ALPM in han mutants indicates that Hand2 is required to facilitate effective differentiation of myocardial progenitors from medial and lateral ALPM territories. (G and H) Dorsal views of han mutant embryos at 30 hpf, anterior to the top. In situ hybridization indicates expression of cmlc2 (magenta) in cardiomyocytes, and immunohistochemistry for uncaged fluorescein (blue) indicates progeny of labeled cells. In han mutants, labeled cells from caudal ALPM can give rise to cardiomyocytes (white arrowhead; [H]) but also frequently become seemingly undifferentiated cells (black arrowheads; [G and H]) flanking the cardiomyocytes. Labeled cells also contribute to pharyngeal pouches (arrows; [G and H]). (I) Fate map of han mutant caudal ALPM. For each region tested, pie charts depict the proportions of experimental embryos producing labeled myocardial progeny (blue) and only noncardiac labeled progeny (green). Myocardial progenitors were found in all regions examined, but the frequency with which labeled han mutant ALPM produced cardiomyocytes was reduced, relative to wild-type, throughout both medial and lateral territories (compare to Figure 3B). See Table 1 for data reflected in schematic. (J–O) han mutants exhibit ineffective myocardial differentiation. Two-color fluorescent in situ hybridization at 24 hpf, dorsal views, anterior to the top. The scale bar represents 100 μm. (J and M) Overlays of cmlc2 (K and N) and nkx2.5 (L and O) expression. In wild-type embryos (J–L), cmlc2 and nkx2.5 are both expressed throughout the heart tube. Additional expression of nkx2.5 marks the forming pharyngeal pouches (asterisks). (M–O) In han mutants, a reduced number of cardiomyocytes span the midline. Undifferentiated, nkx2.5-expressing ALPM cells (arrows) flank the cardiomyocytes. EXPRESSION / LABELING:
PHENOTYPE:
|
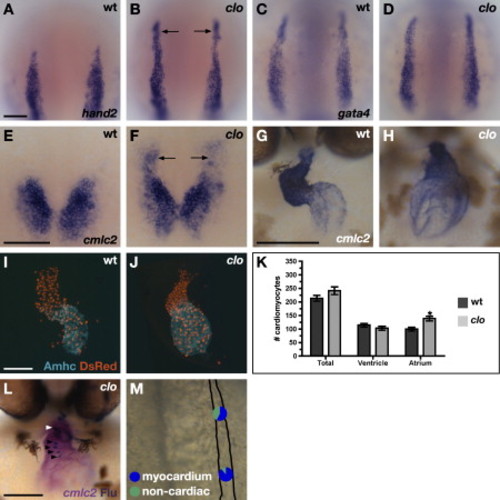
clo Mutants Generate Ectopic Cardiomyocytes (A–H) In situ hybridization depicts expression of hand2 (A and B), gata4 (C and D), and cmlc2 (E–H) in wild-type (A, C, E, and G) and clo mutant (B, D, F, and H) embryos. (A–F) Dorsal views, anterior to the top, at the 7 somite (A–D) and 19 somite (E and F) stages. The scale bars represent 100 μm. (A and B) hand2 is ectopically expressed in the rostral ALPM of clo mutant embryos (arrows; [B]). (C and D) Expression of gata4 is indistinguishable between wild-type and clo mutant embryos, indicating normal rostral ALPM morphology. (E and F) clo mutants exhibit a rostral extension of cmlc2 expression (arrows). (G and H) Frontal views, dorsal to the top. At 48 hpf, the wild-type heart is looped, with morphologically distinct chambers, whereas the clo mutant heart appears unlooped, with a small, compact ventricle and a large, dilated atrium. (I–K) clo mutant hearts contain too many cardiomyocytes. The scale bar represents 100 μm. (I and J) Frontal views of hearts at 52 hpf. Immunofluorescence indicates that both chambers express the transgene Tg(cmlc2:DsRed2-nuc) (red) (Mably et al., 2003). Atria are labeled with the anti-Amhc antibody S46 (aqua) (Berdougo et al., 2003). (K) Counting of cardiomyocyte nuclei reveals a statistically significant increase (asterisk) in the number of atrial cardiomyocytes in clo mutants (p < 0.002, Student's t test; n = 11 of each genotype). The bar graph indicates mean and standard error of each data set. (L and M) Fate map of the rostral ALPM in clo mutants indicates formation of ectopic myocardial progenitors. The scale bar represents 100 μm. (L) Frontal view of clo mutant embryo at 44 hpf, dorsal to the top. In situ hybridization indicates expression of cmlc2 (magenta) in cardiomyocytes, and immunohistochemistry for uncaged fluorescein (blue) indicates progeny of labeled cells. In this example, labeled cardiomyocytes are found in the atrium (black arrowheads) and in the ventricle (white arrowhead). (M) Fate map of clo mutant rostral ALPM. For each region tested, pie charts depict the proportions of experimental embryos producing labeled myocardial progeny (blue) and only noncardiac labeled progeny (green). See Table 1 for data reflected in schematic. In clo mutants, both rostral ALPM regions frequently gave rise to cardiomyocytes, indicating a significant fate transformation (compare to Figure 3B). We have not performed fate map experiments in the clo mutant medial or lateral ALPM, as clo mutants do not seem to exhibit significant changes in gene expression patterns in these territories (our unpublished data). EXPRESSION / LABELING:
PHENOTYPE:
|
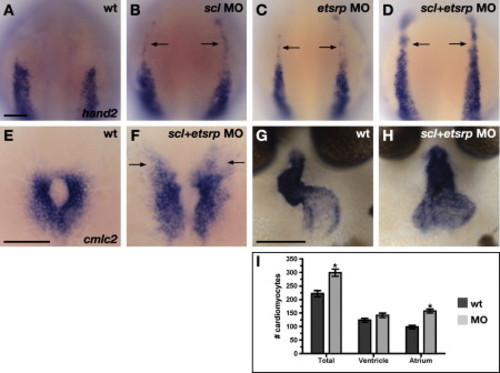
Latent Cardiac Potential in Rostral ALPM Is Revealed by Inhibition of Vasculogenesis and Myelopoiesis (A–H) In situ hybridization depicts expression of hand2 (A–D) and cmlc2 (E–H) in wild-type (A, E, and G) and MO-injected (B–D, F, and H) embryos. The scale bars represent 100 μm. (A–F) Dorsal views, anterior to the top, at the 7 somite (A–D) and 20 somite (E and F) stages. (G and H) Frontal views, dorsal to the top, at 48 hpf. (A–D) hand2 is ectopically expressed in the rostral ALPM of embryos when scl and etsrp are knocked down. Injections of anti-scl (B) or anti-etsrp (C) MOs caused weak expression of hand2 in rostral ALPM (arrows; anti-scl MOs, n = 6/10; anti-etsrp MOs, n = 6/12). Rostral hand2 expression was not observed in control sibling embryos (n = 0/24). Injection of anti-scl+etsrp MOs (D) caused robust expression of hand2 in rostral ALPM (arrows; strong expression, n = 10/17; weak expression, n = 7/17). Thus, injection of anti-scl+etsrp MOs phenocopies a loss of clo function. (E and F) Injection of anti-scl+etsrp MOs causes a rostral extension of cmlc2 expression (arrows; injected embryos, n = 25/31; control siblings, n = 0/33). (G and H) Injection of anti-scl+etsrp MOs results in cardiac chamber morphology resembling that of clo mutants (injected embryos, n = 8/10; control siblings, n = 0/15). (I) Hearts of anti-scl+etsrp MO-injected embryos contain too many cardiomyocytes. Counting of cardiomyocyte nuclei reveals statistically significant increases (asterisks) in the total number of cardiomyocytes and the number of atrial cardiomyocytes in MO-injected embryos (p < 0.0002, Student's t test; n = 13 uninjected controls and 15 injected embryos). The bar graph indicates mean and standard error of each data set. |
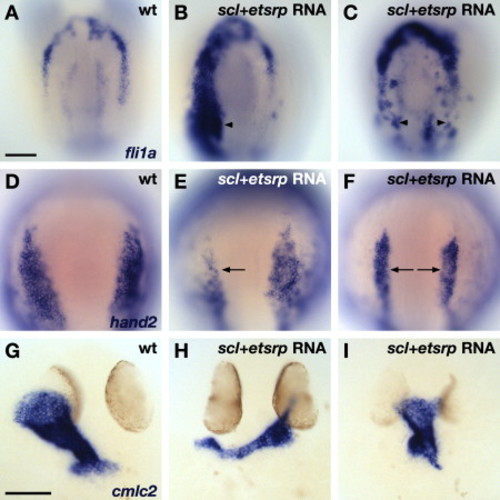
Overexpression of scl and etsrp Promotes Vasculogenesis and Inhibits Heart Formation. In situ hybridization depicts expression of fli1a (A–C), hand2 (D–F), and cmlc2 (G–I) in wild-type (A, D, and G) and scl+etsrp RNA-injected embryos displaying severe (B, E, and H) and moderate (C, F, and I) phenotypes. Dorsal views, anterior to the top, at the 7 somite (A–F) and 30 hpf (G–I) stages. The scale bars represent 100 μm. (A–C) Overexpression of scl and etsrp induces ectopic expression of fli1a, including expression within the HFR (arrowheads; severe phenotype, n = 7/15; moderate phenotype, n = 5/15). (D–F) RNA-injected embryos exhibit reduced expression of hand2 (arrows; severe phenotype, n = 14/34; moderate phenotype, n = 15/34). (G–I) RNA-injected embryos exhibit small, dysmorphic hearts (severe phenotype, n = 9/11; moderate phenotype, n = 2/11). |
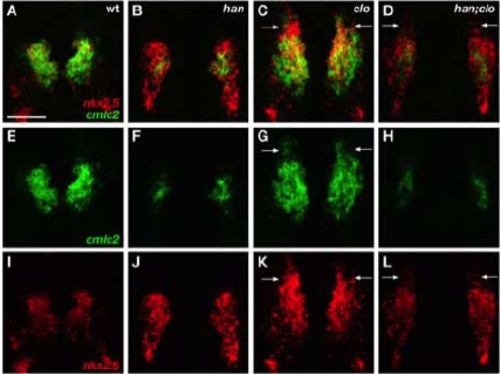
Efficient Differentiation of Rostral Cardiomyocytes in clo Mutant Embryos Requires Hand2 (A-L) Two-color fluorescent in situ hybridization at the 20 somite stage, dorsal views, anterior to the top. Scale bar represents 100 μm. (A-D) Overlays of cmlc2 (E-H) and nkx2.5 (I-L) expression. Wild-type embryos (A,E,I) exhibit efficient myocardial differentiation of nkx2.5- expressing cells, in contrast to the limited differentiation observed in han mutants (B,F,J). Examination of han;clo double mutants (D,H,L) demonstrates that ectopic myocardial differentiation in nkx2.5-expressing rostral ALPM (arrows, C,D,G,K,L), as observed in clo mutants (C,G,K), also requires Hand2 function. Therefore, cmlc2 expression in han;clo double mutants (H) appears similar to cmlc2 expression in han mutants (F). EXPRESSION / LABELING:
|
Reprinted from Developmental Cell, 13(2), Schoenebeck, J.J., Keegan, B.R., and Yelon, D., Vessel and blood specification override cardiac potential in anterior mesoderm, 254-267, Copyright (2007) with permission from Elsevier. Full text @ Dev. Cell