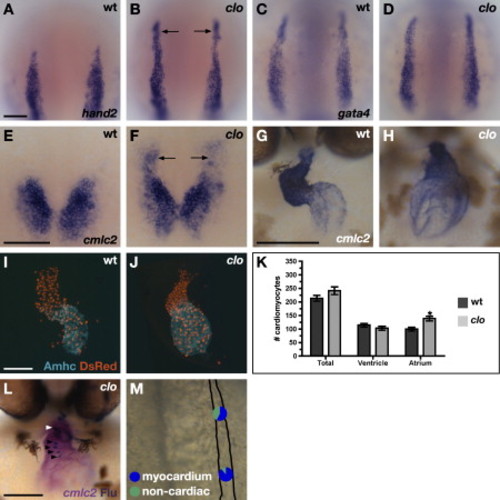
clo Mutants Generate Ectopic Cardiomyocytes (A–H) In situ hybridization depicts expression of hand2 (A and B), gata4 (C and D), and cmlc2 (E–H) in wild-type (A, C, E, and G) and clo mutant (B, D, F, and H) embryos. (A–F) Dorsal views, anterior to the top, at the 7 somite (A–D) and 19 somite (E and F) stages. The scale bars represent 100 μm. (A and B) hand2 is ectopically expressed in the rostral ALPM of clo mutant embryos (arrows; [B]). (C and D) Expression of gata4 is indistinguishable between wild-type and clo mutant embryos, indicating normal rostral ALPM morphology. (E and F) clo mutants exhibit a rostral extension of cmlc2 expression (arrows). (G and H) Frontal views, dorsal to the top. At 48 hpf, the wild-type heart is looped, with morphologically distinct chambers, whereas the clo mutant heart appears unlooped, with a small, compact ventricle and a large, dilated atrium. (I–K) clo mutant hearts contain too many cardiomyocytes. The scale bar represents 100 μm. (I and J) Frontal views of hearts at 52 hpf. Immunofluorescence indicates that both chambers express the transgene Tg(cmlc2:DsRed2-nuc) (red) (Mably et al., 2003). Atria are labeled with the anti-Amhc antibody S46 (aqua) (Berdougo et al., 2003). (K) Counting of cardiomyocyte nuclei reveals a statistically significant increase (asterisk) in the number of atrial cardiomyocytes in clo mutants (p < 0.002, Student's t test; n = 11 of each genotype). The bar graph indicates mean and standard error of each data set. (L and M) Fate map of the rostral ALPM in clo mutants indicates formation of ectopic myocardial progenitors. The scale bar represents 100 μm. (L) Frontal view of clo mutant embryo at 44 hpf, dorsal to the top. In situ hybridization indicates expression of cmlc2 (magenta) in cardiomyocytes, and immunohistochemistry for uncaged fluorescein (blue) indicates progeny of labeled cells. In this example, labeled cardiomyocytes are found in the atrium (black arrowheads) and in the ventricle (white arrowhead). (M) Fate map of clo mutant rostral ALPM. For each region tested, pie charts depict the proportions of experimental embryos producing labeled myocardial progeny (blue) and only noncardiac labeled progeny (green). See Table 1 for data reflected in schematic. In clo mutants, both rostral ALPM regions frequently gave rise to cardiomyocytes, indicating a significant fate transformation (compare to Figure 3B). We have not performed fate map experiments in the clo mutant medial or lateral ALPM, as clo mutants do not seem to exhibit significant changes in gene expression patterns in these territories (our unpublished data).
|
