
- Title
-
Dynamic and sequential patterning of the zebrafish posterior hindbrain by retinoic acid
- Authors
- Maves, L., and Kimmel, C.B.
- Source
- Full text @ Dev. Biol.
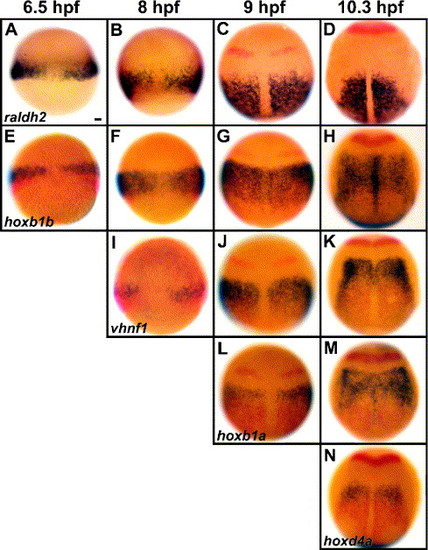
Rhombomere-specification factors initiate expression sequentially near the source of RA synthesis. Wild-type embryos are stained in blue for raldh2 (A–D), hoxb1b (E–H), vhnf1 (I–K), hoxb1a (L–M) and hoxd4a (N). Other markers in red are pax2a to label the early midbrain–hindbrain boundary (MHB, Krauss et al., 1991; C–D, G–H, J–K, L–M, N) and raldh2 (E–N). Dorsal views show anterior to the top. Stages are shown at the top of each column: 6.5 hpf (60% epiboly) (A, E), 8 hpf (80% epiboly) (B, F, I), 9 hpf (90% epiboly) (C, G, J, L), 10.3 hpf (1 somite (s)) (D, H, K, M, N). Double labels of raldh2 (in red) and hoxb1b (E), vhnf1 (I), hoxb1a (L) and hoxd4a (N) show that these four factors initiate near the source of RA synthesis. Scale bar: 50 μm. EXPRESSION / LABELING:
|
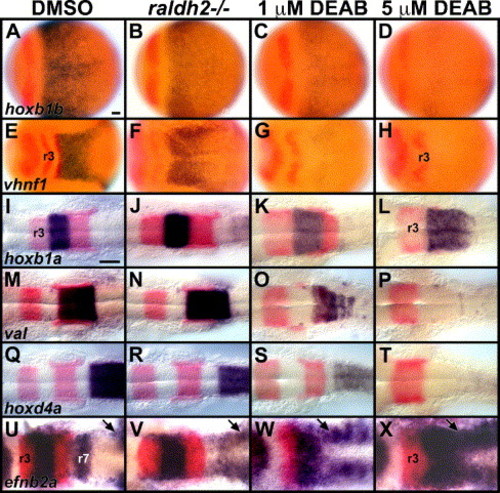
Posterior rhombomere markers require progressively higher levels of RA signaling. Embryos are stained in blue for hoxb1b at 10 hpf (bud stage) (A–D), vhnf1 at 10.3–10.6 hpf (1–2 s) (E–H), at 18–19 hpf (18–20 s), hoxb1a (I–L), val (M–P) and hoxd4a (Q–T) and efnb2a at 11.6 hpf (5 s) (U–X). Other markers in red are pax2a, to label the MHB (A–H) and inner ear (I–T), and krox-20 (E–X), which labels r3 and r5 (Oxtoby and Jowett, 1993). Dorsal views show anterior to the left. Pharmacological treatment or genotype is shown at the top of each column. Control embryos treated with DMSO show wild-type expression patterns (A, E, I, M, Q, U). raldh2 mutant embryos show subtle reduction in expression of hoxb1b (B, 7/7 embryos), vhnf1 (F, 9/11 embryos), hoxd4a (R, 9/9 embryos) and efnb2a (V, 14/14 embryos show reduced expression in r7) and slight expansion of hoxb1a in r4 (J, 9/9 embryos), krox-20 in r3 and r5 (J, N, R, 17/17 embryos) and val in r5/r6 (N, 8/8 embryos). 1 μM DEAB-treated embryos show more severe reduction in expression of hoxb1b (C, 18/18 embryos), vhnf1 (G, 18/18 embryos), krox-20 in r5 (K, O, S, 38/47 embryos), val in r5/r6 (O, 18/23) and hoxd4a (S, 24/24 embryos), greater expansion of domains of krox-20 in r3 (K, O, S, 47/47 embryos) and hoxb1a in r4 (K, 21/21 embryos) and loss of efnb2a in r7 (W, 17/17 embryos). 1 μM DEAB-treated embryos can also show expansion of r5 and reduced r6 (not shown, 9/47 embryos). 5 μM DEAB-treated embryos show even more severe reduction of hoxb1b expression (D, 15/15 embryos), loss of expression of vhnf1 (H, 15/15 embryos), krox-20 in r5 (L, P, T, 31/41 embryos), val in r5–r6 (P, 20/28 embryos) and efnb2a in r7 (X, 17/17 embryos), and even greater expansion of domains of krox-20 in r3 (L, P, T, 41/41 embryos) and hoxb1a in r4 (L, 12/12 embryos). The val-expressing cells in r4 are the Mauthner neurons (Moens et al., 1998). The arrows in U–X point to efnb2a expression in developing somites (Durbin et al., 1998), posterior to the r7 efnb2a domain in control (U) and raldh2 mutant (V) embryos. r3, rhombomere 3 krox-20 expression. Scale bars: 50 μm. EXPRESSION / LABELING:
|
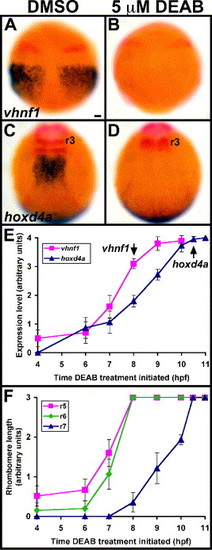
RA synthesis is required for initiation of posterior hindbrain markers. (A–D) Control (A, C) and 5 µM DEAB-treated (B, D) embryos are stained in blue for vhnf1 (A, B) and hoxd4a (C, D). Other markers in red are pax2a (A–D) and krox-20 (C, D). Dorsal views show anterior to the top. Treatments were initiated at 4 hpf (sphere stage), and embryos were fixed at 9 hpf (90% epiboly) (A, B) or 10.6 hpf (2 s) (C, D). For vhnf1, 10/10 DEAB-treated embryos showed loss of expression. For hoxd4a, 10/10 DEAB-treated embryos showed loss of hindbrain expression as well as loss of r5 krox-20 expression. r3, rhombomere 3 krox-20 expression. Scale bar: 50 μm. (E) RA synthesis is required for initiation, but not maintenance, of vhnf1 and hoxd4a. Embryos were treated with 5 μM DEAB beginning at stages between 4 hpf and 11 hpf (3 s). Arrows point to normal initiation times of vhnf1 and hoxd4a expression. For vhnf1 analysis, embryos were treated until 10.3 hpf (1 s) then were fixed and stained for vhnf1 expression. For hoxd4a analysis, embryos were treated until 18 hpf (18 s) then were fixed and stained for hoxd4a and krox-20 expression. Levels of hindbrain expression were scored on a 0–4 scale, with 0 representing no expression and 4 representing wild-type levels. n = 10 for each vhnf1 data point. n e 12 for each hoxd4a data point. (F) Specification of r5–r6 and r7 has distinct temporal requirements for RA synthesis. The same series of treatments were used as for panel (E). For r5 analysis, krox-20 expression was scored in 18 hpf embryos. For r6 analysis, val (non-overlapping r5 krox-20) expression was scored in 18 hpf embryos. For r7 analysis, efnb2a expression was scored in embryos fixed after treatment until 11.6 hpf (5 s). Rhombomere length was scored on a 0–3 scale, with 0 representing no expression and 3 representing wild type or longer lengths of expression domains. n e 20 for each r5 data point. n e 10 for each r6 data point. n e 14 for each r7 data point. Error bars represent 95% confidence interval. EXPRESSION / LABELING:
|
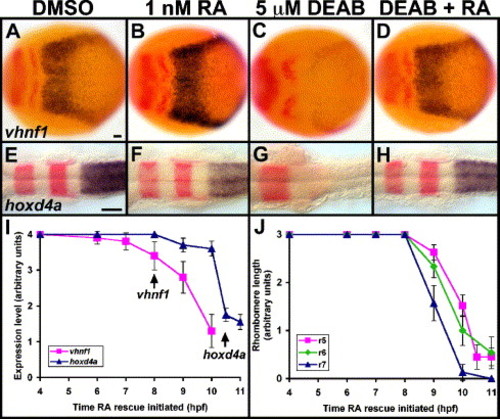
RA rescues DEAB treatment and is not required until posterior marker initiation. (A–H) Control (A, E), 1 nM RA-treated (B, F), 5 μM DEAB-treated (C, G) and 5 μM DEAB + 1 nM RA-treated (D, H) embryos are stained in blue for vhnf1 (A–D) and hoxd4a (E–H). Other markers in red are pax2a and krox-20. Dorsal views show anterior to the left. Treatments were initiated at 4 hpf (sphere stage), and embryos were fixed at 10.3 hpf (1 s) (A–D) or 18 hpf (18 s) (E–H). r3, rhombomere 3 krox-20 expression. Scale bars: 50 μm. (I) RA can rescue DEAB treatment up to the time of either vhnf1 or hoxd4a initiation. Embryos were treated with 5 μM DEAB beginning at 4 hpf then were additionally treated with 1 nM RA beginning at stages between 4 hpf and 11 hpf (3 s). Arrows point to normal initiation times of vhnf1 and hoxd4a expression. For vhnf1 analysis, embryos were treated until 10.3 hpf then were fixed and stained for vhnf1 expression. For hoxd4a analysis, embryos were treated until 18 hpf then were fixed and stained for hoxd4a and krox-20 expression. Levels of hindbrain expression were scored on a 0–4 scale, with 0 representing no expression and 4 representing wild-type levels. n = 10 for each vhnf1 data point. n e 18 for each hoxd4a data point. 10/10 DEAB-treated/no RA controls showed little or no vhnf1 expression (see Fig. 3E). 12/12 DEAB-treated/no RA controls showed no hoxd4a expression (see Fig. 3E). Other control embryos were treated with RA alone at each time point: vhnf1 (n = 10 each time point) and hoxd4a (n = 20 each time point) expression appeared largely normal. (J) Rescue of r5–r6 and r7 has distinct temporal requirements for RA. The same series of treatments were used as for panel (I). For r5 analysis, krox-20 expression was scored in 18 hpf embryos. For r6 analysis, val (non-overlapping r5 krox-20) expression was scored in 18 hpf (18 s) embryos. For r7 analysis, efnb2a expression was scored in embryos fixed after treatment until 11.6 hpf (5 s). Rhombomere length was scored on a 0–3 scale, with 0 representing no expression and 3 representing wild type or longer lengths of expression domains. n ≥ 20 for each r5 data point. n ≥ 13 for each r6 data point. n ≥ 13 for each r7 data point. Error bars represent 95% confidence interval. EXPRESSION / LABELING:
|
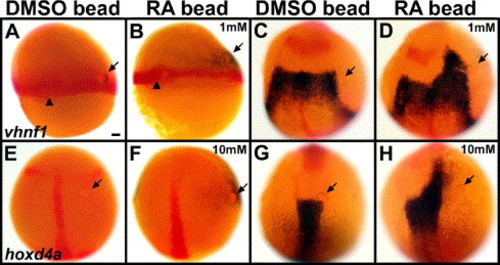
RA beads can induce posterior hindbrain markers ectopically and prematurely. Embryos with control (A, C, E, G), 1 mM RA (B, D) or 10 mM RA (F, H) beads placed in the margin at 6 hpf (shield stage) and stained in blue for vhnf1 at 7 hpf (65% epiboly) (A, B) or 10.3 hpf (1 s) (C, D) or for hoxd4a at 10 hpf (bud stage) (E, F) or 11.3 hpf (4 s) (G, H). Markers in red are no tail (ntl, Schulte-Merker et al., 1992), which labels the margin and the shield/dorsal midline (A–B) and the notochord (C–F) and also pax2a to label the MHB (C–H) and the early ear primordia (G–H). Dorsal views show anterior to the top. Arrows point to beads. Arrowheads point to the shield/dorsal midline (A–B). (A–D) vhnf1 initiates prematurely on the RA-bead side (B) in 8/8 cases, compared with the control side (0/8) and with control bead embryos (A, 0/8). If bead-implanted embryos are allowed to develop further, to 10.3 hpf, 10/10 control embryos show normal vhnf1 expression (C), and 9/9 embryos with 1 mM RA beads show anterior expansion of vhnf1 on the RA-bead side (D). (E–H) hoxd4a initiates prematurely on the RA-bead side (F) in 7/7 cases, compared with the control side (0/7) and with control bead embryos (E, 0/10). If these embryos are allowed to develop further, to 11.3 hpf, 10/10 control embryos show normal hoxd4a expression (G), and 9/9 embryos with 10 mM RA beads show anterior expansion of hoxd4a on the RA-bead side (H). r3: rhombomere 3 krox-20 expression. Scale bar: 50 μm. |
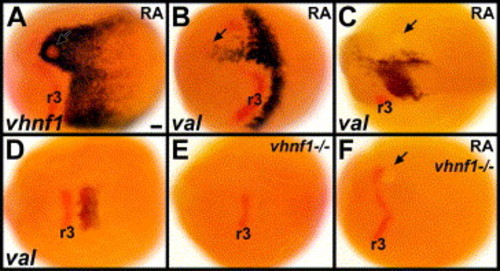
RA induces val expression through vHnf1. (A–C) Embryos with 0.1 mM RA beads placed near the anterior presumptive hindbrain at 6 hpf (shield stage) are stained in red for krox-20 and in blue for vhnf1 at 10.3 hpf (1 s) (A), val at 10.3 hpf (B) or val at 15 hpf (12 s) (C). 13/13 0.1 mM RA beads induced vhnf1 expression unilaterally in the anterior hindbrain, generally surrounding the bead (A). 10/10 0.1 mM RA beads induced val expression unilaterally in the anterior hindbrain (B). (D–F) Wild-type sibling (D), vhnf1 mutant control (E) and vhnf1 mutant embryo with a 0.1 mM RA bead placed near the anterior presumptive hindbrain at 6 hpf (F). Embryos are stained in blue for val and in red for krox-20 at about 11.3 hpf (4 s). 3/8 control vhnf1 mutant embryos showed no val expression; 5/8 showed some weak bilateral val expression (E). RA beads are unable to induce any val expression in vhnf1 mutants (F). 6/9 vhnf1 mutant embryos with RA beads showed no val expression (F); 3/9 showed some very weak bilateral val expression, similar to what is observed in control vhnf1 mutant embryos. 14/14 wild-type sibling embryos with RA beads showed ectopic unilateral val expression. Dorsal views show anterior to the left. Arrows point to beads. r3: rhombomere 3 krox-20 expression. Scale bar: 50 μm. EXPRESSION / LABELING:
|
Reprinted from Developmental Biology, 285(2), Maves, L., and Kimmel, C.B., Dynamic and sequential patterning of the zebrafish posterior hindbrain by retinoic acid, 593-605, Copyright (2005) with permission from Elsevier. Full text @ Dev. Biol.