
|
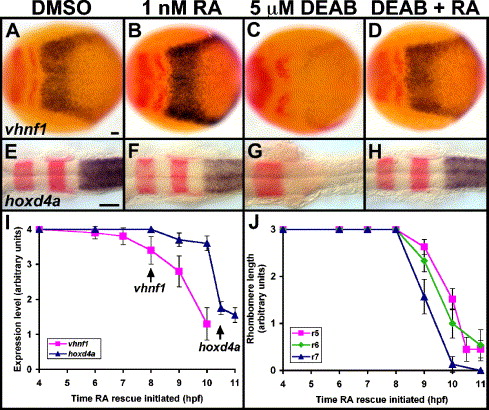
Fig. 4 RA rescues DEAB treatment and is not required until posterior marker initiation. (A–H) Control (A, E), 1 nM RA-treated (B, F), 5 μM DEAB-treated (C, G) and 5 μM DEAB + 1 nM RA-treated (D, H) embryos are stained in blue for vhnf1 (A–D) and hoxd4a (E–H). Other markers in red are pax2a and krox-20. Dorsal views show anterior to the left. Treatments were initiated at 4 hpf (sphere stage), and embryos were fixed at 10.3 hpf (1 s) (A–D) or 18 hpf (18 s) (E–H). r3, rhombomere 3 krox-20 expression. Scale bars: 50 μm. (I) RA can rescue DEAB treatment up to the time of either vhnf1 or hoxd4a initiation. Embryos were treated with 5 μM DEAB beginning at 4 hpf then were additionally treated with 1 nM RA beginning at stages between 4 hpf and 11 hpf (3 s). Arrows point to normal initiation times of vhnf1 and hoxd4a expression. For vhnf1 analysis, embryos were treated until 10.3 hpf then were fixed and stained for vhnf1 expression. For hoxd4a analysis, embryos were treated until 18 hpf then were fixed and stained for hoxd4a and krox-20 expression. Levels of hindbrain expression were scored on a 0–4 scale, with 0 representing no expression and 4 representing wild-type levels. n = 10 for each vhnf1 data point. n e 18 for each hoxd4a data point. 10/10 DEAB-treated/no RA controls showed little or no vhnf1 expression (see Fig. 3E). 12/12 DEAB-treated/no RA controls showed no hoxd4a expression (see Fig. 3E). Other control embryos were treated with RA alone at each time point: vhnf1 (n = 10 each time point) and hoxd4a (n = 20 each time point) expression appeared largely normal. (J) Rescue of r5–r6 and r7 has distinct temporal requirements for RA. The same series of treatments were used as for panel (I). For r5 analysis, krox-20 expression was scored in 18 hpf embryos. For r6 analysis, val (non-overlapping r5 krox-20) expression was scored in 18 hpf (18 s) embryos. For r7 analysis, efnb2a expression was scored in embryos fixed after treatment until 11.6 hpf (5 s). Rhombomere length was scored on a 0–3 scale, with 0 representing no expression and 3 representing wild type or longer lengths of expression domains. n ≥ 20 for each r5 data point. n ≥ 13 for each r6 data point. n ≥ 13 for each r7 data point. Error bars represent 95% confidence interval.
Reprinted from Developmental Biology, 285(2), Maves, L., and Kimmel, C.B., Dynamic and sequential patterning of the zebrafish posterior hindbrain by retinoic acid, 593-605, Copyright (2005) with permission from Elsevier. Full text @ Dev. Biol.