FIGURE SUMMARY
Title

Multiomic atlas with functional stratification and developmental dynamics of zebrafish cis-regulatory elements

Authors
Baranasic, D., Hörtenhuber, M., Balwierz, P.J., Zehnder, T., Mukarram, A.K., Nepal, C., Várnai, C., Hadzhiev, Y., Jimenez-Gonzalez, A., Li, N., Wragg, J., D'Orazio, F.M., Relic, D., Pachkov, M., Díaz, N., Hernández-Rodríguez, B., Chen, Z., Stoiber, M., Dong, M., Stevens, I., Ross, S.E., Eagle, A., Martin, R., Obasaju, O., Rastegar, S., McGarvey, A.C., Kopp, W., Chambers, E., Wang, D., Kim, H.R., Acemel, R.D., Naranjo, S., Łapiński, M., Chong, V., Mathavan, S., Peers, B., Sauka-Spengler, T., Vingron, M., Carninci, P., Ohler, U., Lacadie, S.A., Burgess, S.M., Winata, C., van Eeden, F., Vaquerizas, J.M., Gómez-Skarmeta, J.L., Onichtchouk, D., Brown, B.J., Bogdanovic, O., van Nimwegen, E., Westerfield, M., Wardle, F.C., Daub, C.O., Lenhard, B., Müller, F.
Source
Full text @ Nat. Genet.

Comprehensive collection and annotation of zebrafish developmental genomic data.

a, Collection and manual annotation processes of datasets with the DANIO-CODE DCC with highlights of key findings. b, Extent of the open repository for developmental multiomic data for zebrafish with assay type (y axis) and developmental stage (x axis). Data first reported in this study are highlighted with black circles. c, Visualization of temporal dynamics of selected transcriptomic and epigenomic features during development at a developmentally active locus. Coloring of tracks represents developmental series from maternal (blue) to zygotically active stages of embryogenesis (red). Symbols and track colors indicate representative stages (Extended Data Fig. 1d). CNS, central nervous system.

Transcript categories and single-nucleotide resolution 5′ end verification during development.

a, DANIO-CODE transcript 5′ ends supported by CAGE TSS during stages of development. b, Distribution of absolute distance of Ensembl TSSs to CAGE-dominant TSSs in the Prim-5 stage. c, Relationship between guide distance to TSSs and ddCt. Inset: number of dCas guides for all 26 tested genes. d, CAGE-defined TSSs increase the accuracy of promoter identification and support dCas inhibition guide reagent designs. Distance between Ensembl TSSs and CAGE-dominant TSSs (top). Genome view with CRISPR guide position and efficacy, Ensembl and RefSeq transcripts, CAGE and RNA-seq expression (bottom).

Alternative promoter usage and motif activity response analysis.

a, Heat map shows the dynamics of expression levels of reference and alternative promoters across 16 developmental stages represented as images. Expression levels are scaled in the range of 0–1 for each row. Reference and alternative transcripts using the same and different coding sequence (CDS) starts are denoted. Transcript pairs without full CDS annotation are denoted as ambiguous. b, Distribution of correlation coefficient of expression levels of promoters across 16 developmental stages. c, Enrichment of KEGG pathways on multipromoter genes. The adjusted P value cut-off is 0.05, denoted by a vertical dashed line. The number of genes in KEGG pathways and those overlapping with multipromoter genes is shown inside the bars, d, MARA motif activity plots of three TF motifs across development. Posterior means and standard deviations (depicted as error bars) are based on analysis of the expression levels of all n = 27,781 promoters for each sample. Motif logos are depicted as insets. e, Genome browser view of the actin alpha 1a promoter. From the top: ATAC signal, CAGE signal, a single TSR (black), two Ensembl transcripts (dark red) and TFBSs predicted to regulate this TSR (red) are shown. Color intensities of the TFBSs reflect MARA scores of predicted regulatory role of TFs.

Classification of developmental <italic>cis</italic>-regulatory elements.

a, Genome browser screenshot showing ChromHMM classification of PADREs, and respective histone post-translational modification signals used to define them. b, UMAP plot of PADREs at the Prim-5 stage. Each point represents one open chromatin region, colored by functional assignment. c, Occurrence probabilities of chromatin marks for ChromHMM states. The states function was manually assigned using The Roadmap Epigenomic annotations as reference. 1_TssA1, 2_TssA2: active TSS; 3_TssFlank1, 4_TssFlank2, TSS flanking region; 5_EnhA1, active enhancer; 6_EnhFlank, enhancer flanking region; 7_EnhWk1, primed enhancer; 8_Pois, poised elements; 9_PcRep, Polycomb-repressed regions; 10_Quies, quiescent state. dg, UMAP plot showing PADREs overlapping with CAGE promoters (d), CTCF motif (e), eRNA enhancers (f) and transgenically validated enhancers (g). The transgenically validated enhancers are predominantly associated with enhancer-associated chromatin states (Supplementary Table 11). h, UMAP plot showing the mean phastCons score for each PADRE (top right) and overlap with human CNEs (top left). The bottom subpanel shows the distribution of phastCons scores of active enhancers throughout development (left, bars represents interquartile range), as well as the distribution of the phastCons score for PADREs separated by function at the Prim-5 stage. Two-sided Wilcoxon rank sum test was used to calculate P values between promoters and enhancers (P = 2.2 × 10−16) and enhancers and Polycomb-associated elements (P = 2.2 × 10−16). Exons and intergenic regions were added as reference (right) i, Position of cell-type-specific elements on the UMAP plot (top). ATAC, H3K27ac and H3K4me1 signals around the peak summit of cell-type-specific PADREs (bottom).

Developmental dynamics of PADREs.

a, Openness profile of selected SOM classes (4: early; 6: post-ZGA constitutive; 14: late class), and their position density on the UMAP plots of different developmental stages (top). Heat map of signal intensity of ATAC, H3K27ac and H3K4me1 at the Dome and the Prim-5 stages, along with their respective profiles (bottom). b, Position of COPEs, DOPEs and DOPEs marked with H3K27ac in adult tissues on the UMAP plot (left). Profiles of ATAC, H3K27ac and H3K4me1 of COPEs, DOPEs, DOPEs marked in adult tissues, and other constitutive elements throughout development (right).

Chromatin architecture classification and developmental specialization of Pol II gene promoters.

a, Heat map of chromatin accessibility profiles aligned to dominant TSS per promoter at the Prim-5 stage. Nucleosome-free regions (red) are superimposed with nucleosome positioning (blue). Stack height reflects number of promoters. Above each heat map, combined histograms of CAGE expression are shown. Black, forward TSSs; red, reverse orientation TSSs (the scale is amplified ×10 in relation to forward transcription). Nucleosome positioning is symbolized above alignments and black arrows indicate transcription direction; size indicates relative strength. Promoter configuration classes are color-coded consistently in all panels (including Supplementary Fig. 6) b, Aggregated H3K4me1, H3K4me3 (MNase-digested), H3K27ac ChIP–seq signals for classes as in a are aligned to dominant TSS. c, UMAP profiles of promoter classes at the Prim-5 stage. UMAPs are cropped to highlight promoter PADREs. d, Flow diagram indicates the relationship between promoter configuration class at the Dome stage (left edge, Supplementary Fig. 6) and the Prim-5 stage (right edge). Band width represents the number of promoters. e, Violin plot of phastCons vertebrate conservation distribution of promoters. Each class is aligned to a. f, Classification of promoter expression during development with SOMs. On the top right, 5 × 5 diagrams contain violin plots with stage-by-stage expression levels. Blue to red spectrum indicates maternal to zygotic expression dynamics of promoter clusters. Surface areas of gray circles indicate the number of promoters per cluster. Stages of development are symbolized below the SOM array. On the left, mustard: positive and green: negative color spectrum in SOMs indicates the enrichment in promoter overlap between promoter expression classes (SOMs) in each chromatin architecture class a. g, Enriched GO categories for each promoter architecture class.

Dynamics and function of open chromatin and H3K27ac topology organization on early embryo development.

a, Schematic representation of GRBs. Basic components of a GRB. GRB enhancers (green) regulating the target genes span the entire length of the GRB (middle). Typical density pattern of conserved noncoding elements in a GRB, most of which overlap enhancers (top). Hi-C contact matrix within a GRB (bottom). b, Chromatin opening profiles through developmental stages along TADs. c, Genome browser view of a GRB TAD showing H3K27ac signals in the Dome and the Prim-5 stages, H3K27ac ensembles (black bar), CAGE promoters (black blocs) and nonpromoter PADREs (blue active in the Dome stage, red active in the Prim-5 stage and purple PADREs active in both stages). A zoomed-in genome browser view of an H3K27ac ensemble (top, left). d, Aggregate contact enrichment centered on ensembles at stages as indicated. e, TAD compartment score distribution. Positive scores represent A compartments, while negative ones represent B compartments. The comparison was done using two-sided two-sample unpaired Wilcoxon test. g, Heat maps of H3K27ac signal across GRB TADs containing ensembles through developmental stages. TADs are ordered by their width in descending order and fixed on the TAD center. h, CAGE expression patterns of selected gene classes separated by SOM, with the highest and lowest ratios in ensemble-associated genes. Bar plot on the right shows the proportion of ensemble-associated genes in each class. BGT and GST classes are marked on the heat map i, Gene expression pattern of GRB target and bystander genes. The left side bar shows an ensemble association for each gene. The right side bar shows the target or bystander assignment for each gene. Genes in TADs with and without ensembles are separated by a green line. BST and GST classes are indicated on the side. j, Graph showing mean expression and standard error of GRB target genes associated and not associated with early H3K27ac ensembles. k, A model describing the influence of an H3K27ac ensemble on expression of GRB target genes. If the H3K27ac ensemble is in contact with the target gene, it can be expressed early on.

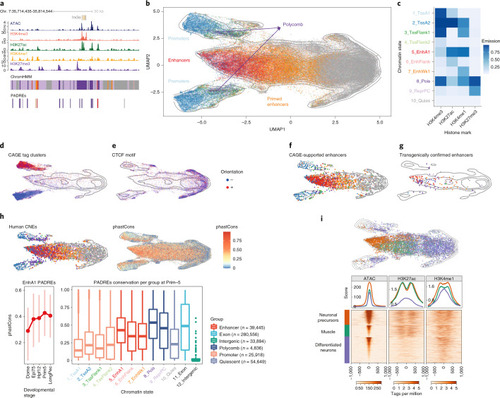
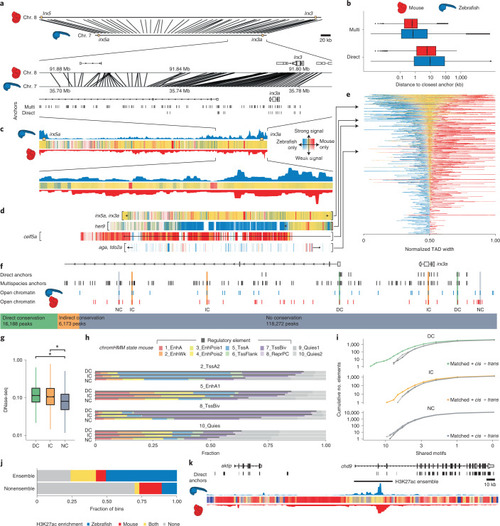
Synteny projections reveal conservation of epigenetic features between zebrafish and mouse.

a, Cross-species comparison of the irx3/5(a) TAD between zebrafish and mouse and a zoom-in on the locus around irx3(a). Connecting lines represent projections of bin centers from zebrafish to mouse. b, Distribution of distances from the bin centers (n = 528,830) to their closest anchors in zebrafish (blue), and from their projections to their closest anchors in mouse (red), using the direct and the multispecies projection approach. c, Epigenetic comparison of the irx3/5(a) TAD. H3K27me3 overlap in mapped regions is indicated as colored bars (yellow, mutually enriched; blue, zebrafish specific; red, mouse specific; Methods). Opacity reflects signal amplitude and is proportional to the maximum H3K27me3 signal in both species. d, H3K27me3 overlap profiles for four selected GRB TADs. TAD boundaries are indicated with square brackets. e, H3K27me3 overlap profiles of all GRB TADs. TADs are ordered by their relative amount of shared signal. Bins are ordered by the amount of shared signal: bins with shared signal appear in the middle, bins with zebrafish- and mouse-specific signals are left and right, respectively. A view of the TADs with their genomic bin order is given in Extended Data Fig. 10d,f. Classification of zebrafish ATAC-seq peaks in the irx3a locus into DC, IC and NC on the basis of overlaps with direct anchors, multispecies anchors and mouse DNase-seq peak projections (Methods). g, Distribution of DNase-seq signal in the mouse genome around the projected regions of the zebrafish ATAC-seq peaks (n = 140,633). Asterisks above the bars indicate the effect size category based on Cohen’s d: very small (not indicated), small (*), medium (**), large (***), very large (****). h, Cross-species comparison of ChromHMM functional states. i, Cumulative distribution of shared motifs in mouse DNase-seq peaks overlapping zebrafish ATAC-seq peaks. j, H3K27ac enrichment (signal ≥80th percentile) within (n = 11,083) and outside (n = 93,020) of enhancer ensembles (P < 2.2 × 10−16, Fisher’s exact test). k, Cross-species comparison of H3K27ac profile around an H3K27ac ensemble neighboring the zebrafish aktip gene.

Acknowledgments
This image is the copyrighted work of the attributed author or publisher, and ZFIN has permission only to display this image to its users. Additional permissions should be obtained from the applicable author or publisher of the image. Full text @ Nat. Genet.