|
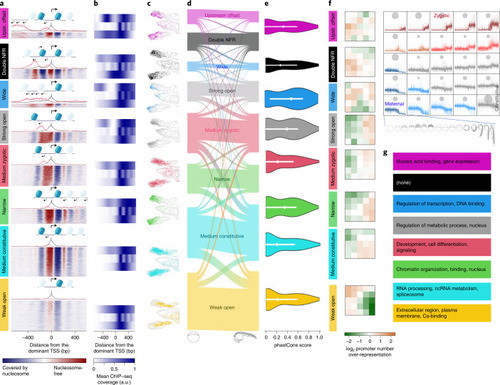
Chromatin architecture classification and developmental specialization of Pol II gene promoters.a, Heat map of chromatin accessibility profiles aligned to dominant TSS per promoter at the Prim-5 stage. Nucleosome-free regions (red) are superimposed with nucleosome positioning (blue). Stack height reflects number of promoters. Above each heat map, combined histograms of CAGE expression are shown. Black, forward TSSs; red, reverse orientation TSSs (the scale is amplified ×10 in relation to forward transcription). Nucleosome positioning is symbolized above alignments and black arrows indicate transcription direction; size indicates relative strength. Promoter configuration classes are color-coded consistently in all panels (including Supplementary Fig. 6) b, Aggregated H3K4me1, H3K4me3 (MNase-digested), H3K27ac ChIP–seq signals for classes as in a are aligned to dominant TSS. c, UMAP profiles of promoter classes at the Prim-5 stage. UMAPs are cropped to highlight promoter PADREs. d, Flow diagram indicates the relationship between promoter configuration class at the Dome stage (left edge, Supplementary Fig. 6) and the Prim-5 stage (right edge). Band width represents the number of promoters. e, Violin plot of phastCons vertebrate conservation distribution of promoters. Each class is aligned to a. f, Classification of promoter expression during development with SOMs. On the top right, 5 × 5 diagrams contain violin plots with stage-by-stage expression levels. Blue to red spectrum indicates maternal to zygotic expression dynamics of promoter clusters. Surface areas of gray circles indicate the number of promoters per cluster. Stages of development are symbolized below the SOM array. On the left, mustard: positive and green: negative color spectrum in SOMs indicates the enrichment in promoter overlap between promoter expression classes (SOMs) in each chromatin architecture class a. g, Enriched GO categories for each promoter architecture class.
|