|
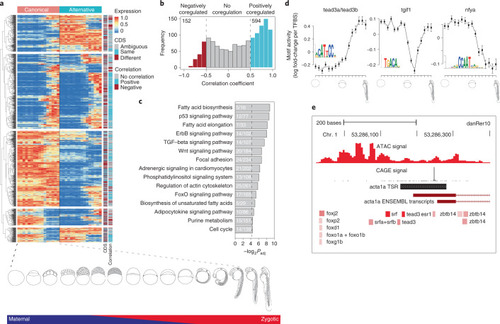
Alternative promoter usage and motif activity response analysis.a, Heat map shows the dynamics of expression levels of reference and alternative promoters across 16 developmental stages represented as images. Expression levels are scaled in the range of 0–1 for each row. Reference and alternative transcripts using the same and different coding sequence (CDS) starts are denoted. Transcript pairs without full CDS annotation are denoted as ambiguous. b, Distribution of correlation coefficient of expression levels of promoters across 16 developmental stages. c, Enrichment of KEGG pathways on multipromoter genes. The adjusted P value cut-off is 0.05, denoted by a vertical dashed line. The number of genes in KEGG pathways and those overlapping with multipromoter genes is shown inside the bars, d, MARA motif activity plots of three TF motifs across development. Posterior means and standard deviations (depicted as error bars) are based on analysis of the expression levels of all n = 27,781 promoters for each sample. Motif logos are depicted as insets. e, Genome browser view of the actin alpha 1a promoter. From the top: ATAC signal, CAGE signal, a single TSR (black), two Ensembl transcripts (dark red) and TFBSs predicted to regulate this TSR (red) are shown. Color intensities of the TFBSs reflect MARA scores of predicted regulatory role of TFs.
|