|
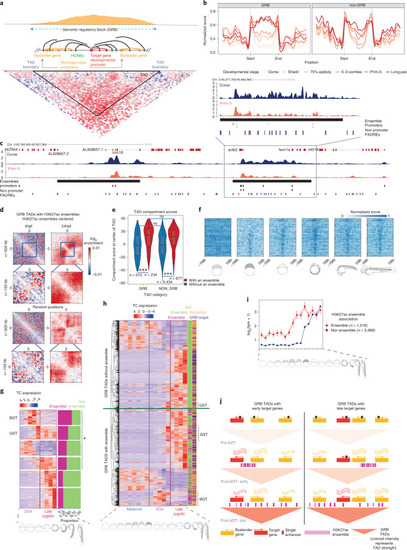
Dynamics and function of open chromatin and H3K27ac topology organization on early embryo development.a, Schematic representation of GRBs. Basic components of a GRB. GRB enhancers (green) regulating the target genes span the entire length of the GRB (middle). Typical density pattern of conserved noncoding elements in a GRB, most of which overlap enhancers (top). Hi-C contact matrix within a GRB (bottom). b, Chromatin opening profiles through developmental stages along TADs. c, Genome browser view of a GRB TAD showing H3K27ac signals in the Dome and the Prim-5 stages, H3K27ac ensembles (black bar), CAGE promoters (black blocs) and nonpromoter PADREs (blue active in the Dome stage, red active in the Prim-5 stage and purple PADREs active in both stages). A zoomed-in genome browser view of an H3K27ac ensemble (top, left). d, Aggregate contact enrichment centered on ensembles at stages as indicated. e, TAD compartment score distribution. Positive scores represent A compartments, while negative ones represent B compartments. The comparison was done using two-sided two-sample unpaired Wilcoxon test. g, Heat maps of H3K27ac signal across GRB TADs containing ensembles through developmental stages. TADs are ordered by their width in descending order and fixed on the TAD center. h, CAGE expression patterns of selected gene classes separated by SOM, with the highest and lowest ratios in ensemble-associated genes. Bar plot on the right shows the proportion of ensemble-associated genes in each class. BGT and GST classes are marked on the heat map i, Gene expression pattern of GRB target and bystander genes. The left side bar shows an ensemble association for each gene. The right side bar shows the target or bystander assignment for each gene. Genes in TADs with and without ensembles are separated by a green line. BST and GST classes are indicated on the side. j, Graph showing mean expression and standard error of GRB target genes associated and not associated with early H3K27ac ensembles. k, A model describing the influence of an H3K27ac ensemble on expression of GRB target genes. If the H3K27ac ensemble is in contact with the target gene, it can be expressed early on.
|