IMAGE

Fig. 5

ID
ZDB-IMAGE-220717-19
Source
Figures for Baranasic et al., 2022
Image
Figure Caption

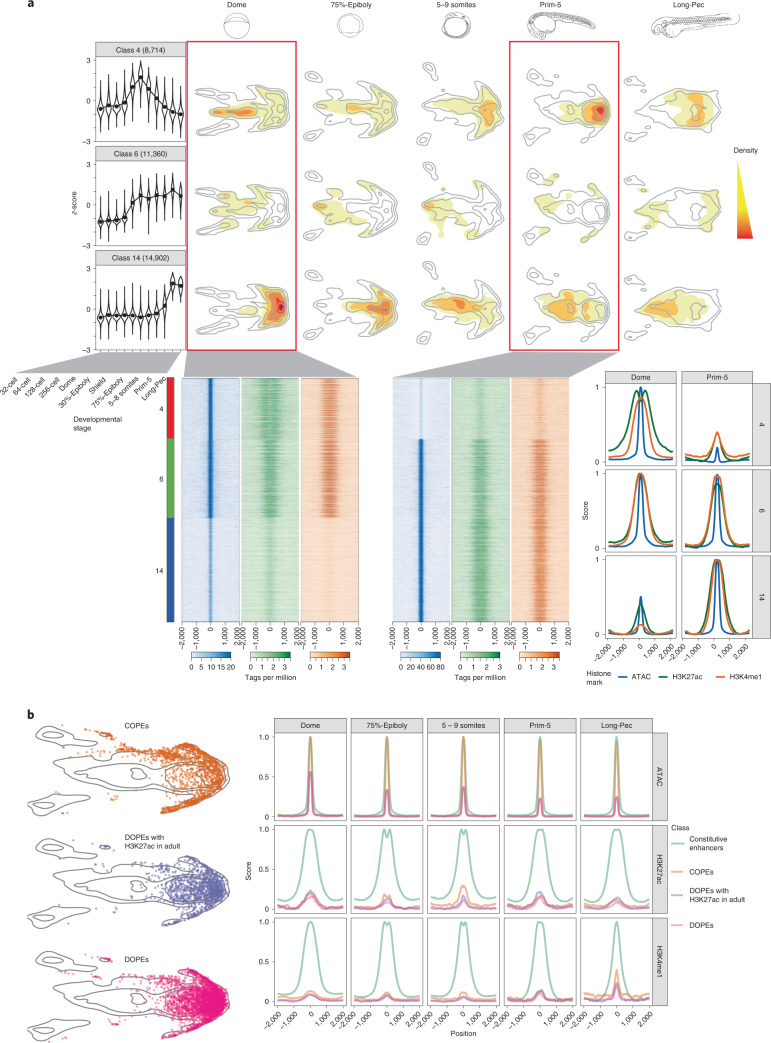
Fig. 5 Developmental dynamics of PADREs.

a, Openness profile of selected SOM classes (4: early; 6: post-ZGA constitutive; 14: late class), and their position density on the UMAP plots of different developmental stages (top). Heat map of signal intensity of ATAC, H3K27ac and H3K4me1 at the Dome and the Prim-5 stages, along with their respective profiles (bottom). b, Position of COPEs, DOPEs and DOPEs marked with H3K27ac in adult tissues on the UMAP plot (left). Profiles of ATAC, H3K27ac and H3K4me1 of COPEs, DOPEs, DOPEs marked in adult tissues, and other constitutive elements throughout development (right).

Acknowledgments
This image is the copyrighted work of the attributed author or publisher, and ZFIN has permission only to display this image to its users. Additional permissions should be obtained from the applicable author or publisher of the image. Full text @ Nat. Genet.