IMAGE

Fig. 8

ID
ZDB-IMAGE-220717-22
Source
Figures for Baranasic et al., 2022
Image
Figure Caption

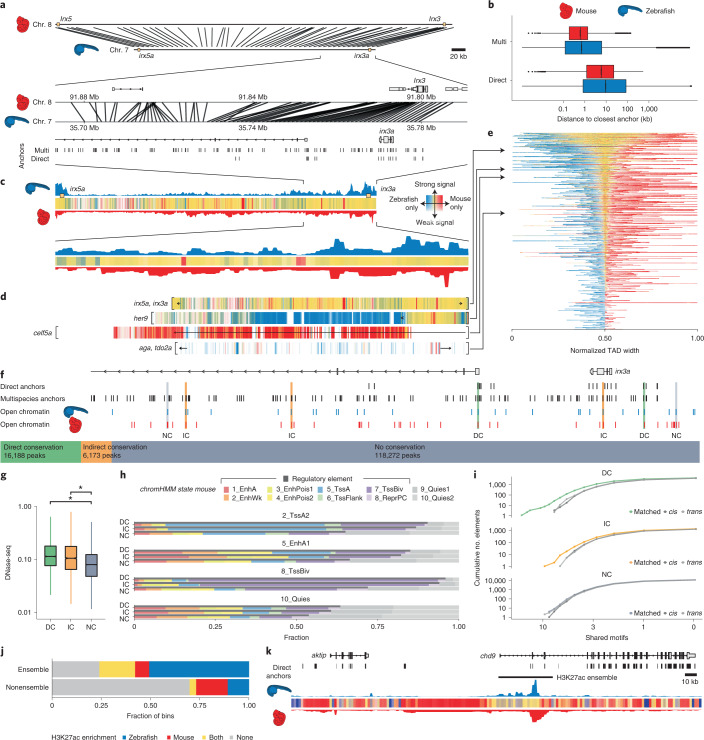
Fig. 8 Synteny projections reveal conservation of epigenetic features between zebrafish and mouse.

a, Cross-species comparison of the irx3/5(a) TAD between zebrafish and mouse and a zoom-in on the locus around irx3(a). Connecting lines represent projections of bin centers from zebrafish to mouse. b, Distribution of distances from the bin centers (n = 528,830) to their closest anchors in zebrafish (blue), and from their projections to their closest anchors in mouse (red), using the direct and the multispecies projection approach. c, Epigenetic comparison of the irx3/5(a) TAD. H3K27me3 overlap in mapped regions is indicated as colored bars (yellow, mutually enriched; blue, zebrafish specific; red, mouse specific; Methods). Opacity reflects signal amplitude and is proportional to the maximum H3K27me3 signal in both species. d, H3K27me3 overlap profiles for four selected GRB TADs. TAD boundaries are indicated with square brackets. e, H3K27me3 overlap profiles of all GRB TADs. TADs are ordered by their relative amount of shared signal. Bins are ordered by the amount of shared signal: bins with shared signal appear in the middle, bins with zebrafish- and mouse-specific signals are left and right, respectively. A view of the TADs with their genomic bin order is given in Extended Data Fig. 10d,f. Classification of zebrafish ATAC-seq peaks in the irx3a locus into DC, IC and NC on the basis of overlaps with direct anchors, multispecies anchors and mouse DNase-seq peak projections (Methods). g, Distribution of DNase-seq signal in the mouse genome around the projected regions of the zebrafish ATAC-seq peaks (n = 140,633). Asterisks above the bars indicate the effect size category based on Cohen’s d: very small (not indicated), small (*), medium (**), large (***), very large (****). h, Cross-species comparison of ChromHMM functional states. i, Cumulative distribution of shared motifs in mouse DNase-seq peaks overlapping zebrafish ATAC-seq peaks. j, H3K27ac enrichment (signal ≥80th percentile) within (n = 11,083) and outside (n = 93,020) of enhancer ensembles (P < 2.2 × 10−16, Fisher’s exact test). k, Cross-species comparison of H3K27ac profile around an H3K27ac ensemble neighboring the zebrafish aktip gene.

Acknowledgments
This image is the copyrighted work of the attributed author or publisher, and ZFIN has permission only to display this image to its users. Additional permissions should be obtained from the applicable author or publisher of the image. Full text @ Nat. Genet.