IMAGE

Fig. 4

ID
ZDB-IMAGE-220717-18
Source
Figures for Baranasic et al., 2022
Image
Figure Caption

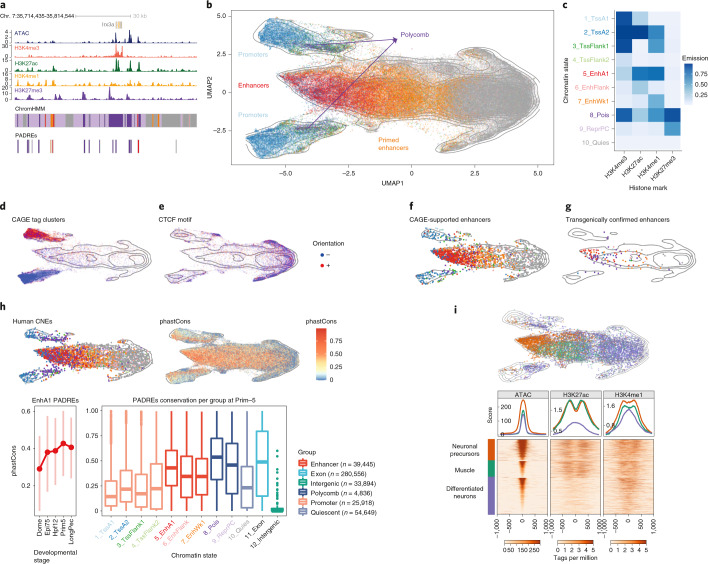
Fig. 4 Classification of developmental <italic>cis</italic>-regulatory elements.

a, Genome browser screenshot showing ChromHMM classification of PADREs, and respective histone post-translational modification signals used to define them. b, UMAP plot of PADREs at the Prim-5 stage. Each point represents one open chromatin region, colored by functional assignment. c, Occurrence probabilities of chromatin marks for ChromHMM states. The states function was manually assigned using The Roadmap Epigenomic annotations as reference. 1_TssA1, 2_TssA2: active TSS; 3_TssFlank1, 4_TssFlank2, TSS flanking region; 5_EnhA1, active enhancer; 6_EnhFlank, enhancer flanking region; 7_EnhWk1, primed enhancer; 8_Pois, poised elements; 9_PcRep, Polycomb-repressed regions; 10_Quies, quiescent state. dg, UMAP plot showing PADREs overlapping with CAGE promoters (d), CTCF motif (e), eRNA enhancers (f) and transgenically validated enhancers (g). The transgenically validated enhancers are predominantly associated with enhancer-associated chromatin states (Supplementary Table 11). h, UMAP plot showing the mean phastCons score for each PADRE (top right) and overlap with human CNEs (top left). The bottom subpanel shows the distribution of phastCons scores of active enhancers throughout development (left, bars represents interquartile range), as well as the distribution of the phastCons score for PADREs separated by function at the Prim-5 stage. Two-sided Wilcoxon rank sum test was used to calculate P values between promoters and enhancers (P = 2.2 × 10−16) and enhancers and Polycomb-associated elements (P = 2.2 × 10−16). Exons and intergenic regions were added as reference (right) i, Position of cell-type-specific elements on the UMAP plot (top). ATAC, H3K27ac and H3K4me1 signals around the peak summit of cell-type-specific PADREs (bottom).

Acknowledgments
This image is the copyrighted work of the attributed author or publisher, and ZFIN has permission only to display this image to its users. Additional permissions should be obtained from the applicable author or publisher of the image. Full text @ Nat. Genet.