
- Title
-
Met is required for oligodendrocyte progenitor cell migration in Danio rerio
- Authors
- Ali, M.F., Latimer, A.J., Wang, Y., Hogenmiller, L., Fontenas, L., Isabella, A.J., Moens, C.B., Yu, G., Kucenas, S.
- Source
- Full text @ G3 (Bethesda)

Kinase inhibitor screen identifies Met as mediator of dorsal OPC migration. (A) Schematic of kinase inhibitor screen and treatment paradigm that tested 430 kinase inhibitors for developmental OPC migration defects. Trichostatin A (TSA), which inhibits OPC specification, was used as a positive control. (B) Cartoon of a lateral view of 76 hpf olig2:egfp larvae spinal cord showing DMSO (negative control), TSA (positive control), and examples of possible hits: reduced OLCs in the dorsal spinal cord (SC) and increased OLCs in the dorsal SC. pMN denotes pMN domain. Yellow dashed lines mark the boundaries of the spinal cord and open yellow arrowheads mark dorsal OLCs. (C) Images taken from 18 h time-lapse movies of DMSO and MK2461-treated 55 hpf olig2:egfp zebrafish larvae. Yellow open arrowheads denote dorsally migrating OPCs. Yellow dashed line denotes ventral edge of the spinal cord. (D–F) Quantifications taken from time-lapse movies of DMSO (n = 7) and MK2461-treated (n = 7) larvae in (C). Mean with SEM. Student’s t-test was used in D–F. Scale bar, 20 μm. EXPRESSION / LABELING:
PHENOTYPE:
|
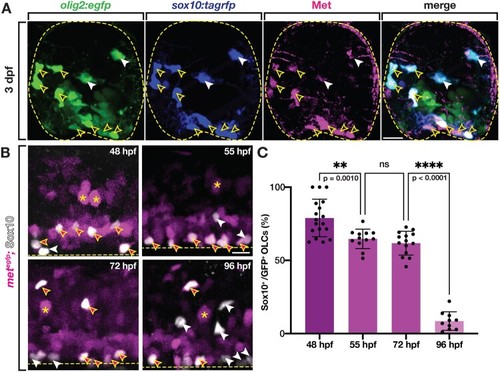
Zebrafish OLCs express Met. (A) Transverse section of 3 dpf sox10:tagrfp;olig2:egfp zebrafish spinal cord labeled with an antibody for Met (magenta). Yellow open arrowheads denote sox10+/Met+ OLCs. White arrowheads denote sox10+/Met− OLCs. Yellow dashed circle denotes boundary of the spinal cord. (B) Lateral view of metegfp zebrafish spinal cords at 48, 55, 72, and 96 hpf labeled with a Sox10 antibody. Asterisks denote examples of met+ motor neurons. Magenta-filled yellow arrowheads denote Sox10+/met+ OPCs, white arrowheads denote Sox10+/met− OLCs. Yellow dashed line denotes ventral edge of the spinal cord. (C) Percentage of OLCs that are Sox10+ and met:gfp+ in 322 μm of spinal cord at 48 hpf (n = 18), 55 hpf (n = 12), 72 hpf (n = 14), and 96 hpf (n = 10). Mean with SEM. Statistical test: one-way ANOVA with Tukey’s Multiple Comparison Test. Scale bars, 10 μm (A), 20 μm (B). EXPRESSION / LABELING:
PHENOTYPE:
|
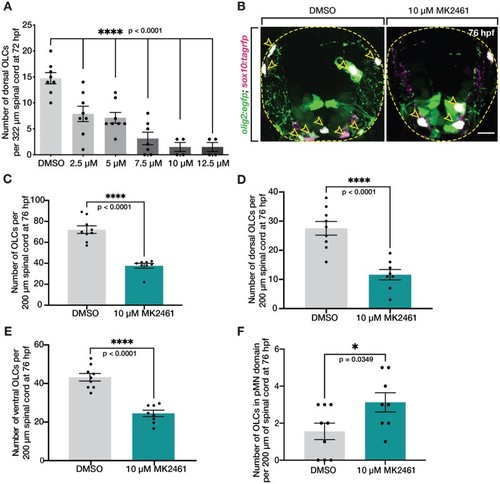
Met receptor inhibition decreases the number of OLCs in spinal cord. (A) Dose–response curve of the number of OLCs in the dorsal spinal cord of fish treated from 24 hpf to 3 dpf with 1% DMSO (n = 8) and 10 μM MK2461 in 1% DMSO in the following doses: 2.5 μM (n = 8), 5 μM (n = 8), 7.5 μM (n = 7), 10 μM (n = 4), and 12.5 μM (n = 8). Statistical test: one-way ANOVA with Dunnett’s Multiple Comparison Test. (B) Transverse sections of 76 hpf olig2:egfp;sox10:tagrfp larvae treated with DMSO or 10 μM MK2461 from 24 hpf to 3 dpf. Yellow open arrowheads denote sox10+/olig2+ OLCs. (C–F) Quantification of olig2+/sox10+ OLCs from 10 sequential 20 μm sections of olig2:egfp;sox10:tagrfp larvae treated with DMSO (n = 9) or MK2461 (n = 8) from 24 hpf to 3 dpf. Mean with SEM. Student’s t-test was used in C–F. Scale bar, 10 μm. EXPRESSION / LABELING:
PHENOTYPE:
|
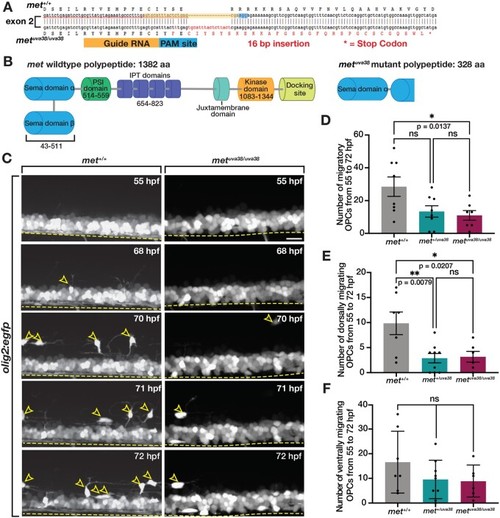
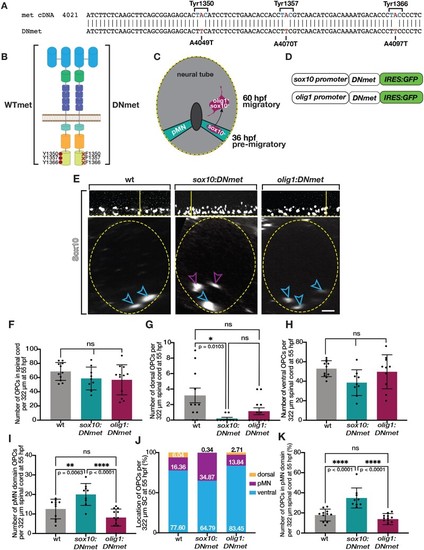
Met is required for initiation of dorsal OPC migration. (A) Diagram of metuva38 mutant created using CRISPR/Cas9 mutagenesis with gRNA target sequence (yellow) and PAM site (blue) resulting in a 16 base pair insertion, which causes a frameshift mutation and early stop codon (asterisk). (B) Diagram of wildtype Met protein and Met mutant polypeptide sequences. (C) Images taken from 18 h time-lapse imaging of 55 hpf olig2:egfp met+/+, and metuva38/uva38 zebrafish larvae. Yellow open arrowheads denote dorsally migrating OPCs. Yellow dashed line denotes ventral edge of spinal cord. (D–F) Quantifications taken from time-lapse movies of 55 hpf olig2:egfp met+/+ (n = 8), met+/uva38 (n = 8), and metuva38/uva38 (n = 6) zebrafish larvae. Mean with SEM. Statistical test: one-way ANOVA with Tukey’s Multiple Comparison Test was used for D–F. Scale bar, 20 μm. |
EXPRESSION / LABELING:
PHENOTYPE:
|
|
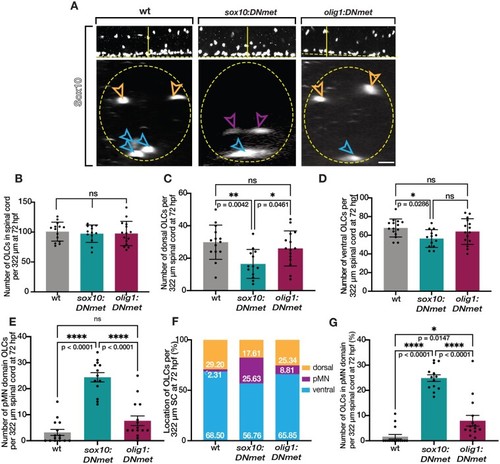
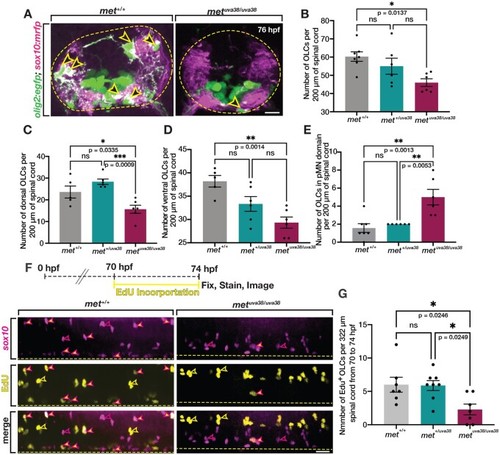
Met knock-down migration defects in pre-migratory OPCs persist to 72 hpf. (A) Lateral (upper) and optical section (lower) views of Sox10 antibody labeled 72 hpf wildtype, EXPRESSION / LABELING:
PHENOTYPE:
|