IMAGE

Figure 7

ID
ZDB-IMAGE-211001-12
Source
Figures for Ali et al., 2021
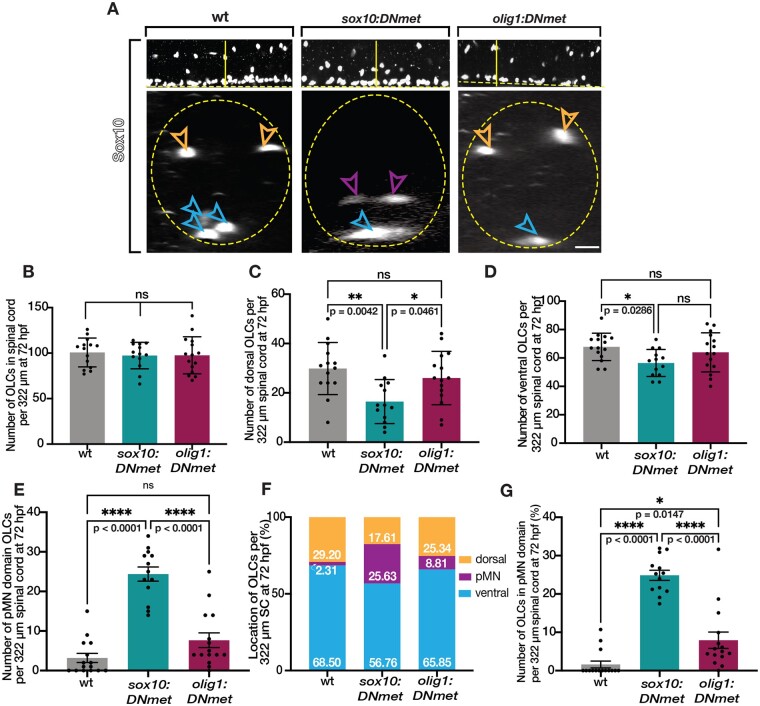
Image
Figure Caption

Figure 7

Met knock-down migration defects in pre-migratory OPCs persist to 72 hpf. (A) Lateral (upper) and optical section (lower) views of Sox10 antibody labeled 72 hpf wildtype, sox10:DNmet, and olig1:DNmet zebrafish larvae. Horizontal yellow line denotes location of orthogonal view shown below. Orange open arrowheads denote dorsal OLCs. Purple open arrowheads denote pMN domain OLCs. Blue open arrowheads denote ventral OLCs. Yellow dashed line denotes ventral edge of the spinal cord. Yellow dashed circle denotes spinal cord boundary. (B–G) Quantifications taken from images of 72 hpf Sox10 antibody labeled wildtype (n = 14), sox10DN:met (n = 13), and olig1:DNmet (n = 15) zebrafish spinal cords. Mean with SEM. Statistical test: one-way ANOVA with Tukey’s Multiple Comparison Test. Scale bar, 20 μm.

Acknowledgments
This image is the copyrighted work of the attributed author or publisher, and ZFIN has permission only to display this image to its users. Additional permissions should be obtained from the applicable author or publisher of the image. Full text @ G3 (Bethesda)