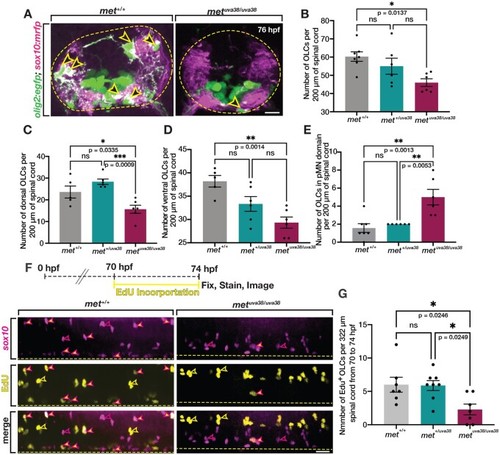
met mutants exhibit reduced OPC proliferation. (A) Transverse sections of 76 hpf olig2:egfp;sox10:mrfp met+/+ and metuva38/uva38 larvae. Open yellow arrowheads denote sox10+/olig2+ OPCs. Dashed yellow circle denotes boundary of the spinal cord. (B–E) Quantifications of olig2+/sox10+ OLCs from ten sequential 20 μm sections of 76 hpf olig2:egfp;sox10:mrfp met+/+ (n = 7), met+/uva38 (n = 6), and metuva38/uva38 (n = 6) larvae. Mean with SEM. Statistical test: one-way ANOVA with Tukey’s Multiple Comparison Test. (F) EdU treatment paradigm and lateral view spinal cord images of 74 hpf sox10:mrfp;met+/+ and metuva38/uva38 zebrafish larvae. Magenta-outlined yellow arrowheads denote sox10+/EdU+ OPCs. Magenta open arrowheads denote sox10+/EdU− OLCs. Yellow open arrowheads denote sox10−/EdU+ cells. Yellow dashed line denotes ventral edge of the spinal cord. (G) Quantifications of sox10+/EdU+ OLCs from spinal cord images of 76 hpf sox10:mrfp EdU labeled met+/+ (n = 7), met+/uva38 (n = 8), and metuva38/uva38 (n = 7) larvae. Mean with SEM. Statistical test: one-way ANOVA with Tukey’s Multiple Comparison Test. Scale bars (A) 10 μm, (F) 20 μm.
|
