
|
Figure 2
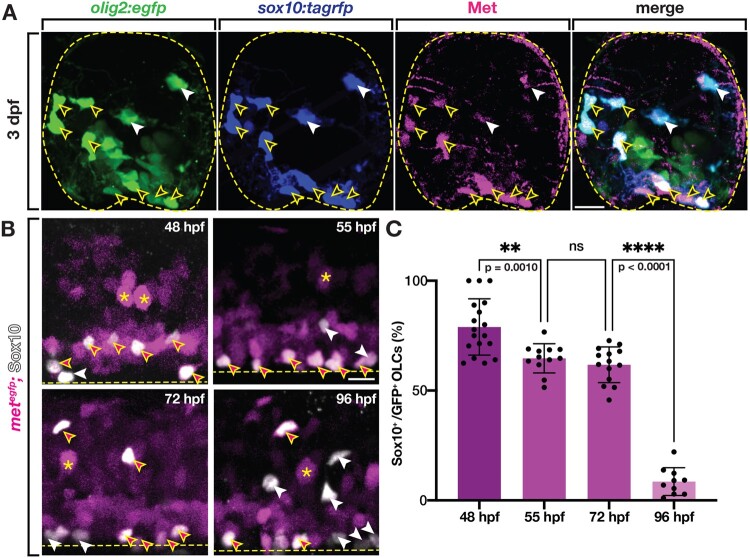
Zebrafish OLCs express Met. (A) Transverse section of 3 dpf sox10:tagrfp;olig2:egfp zebrafish spinal cord labeled with an antibody for Met (magenta). Yellow open arrowheads denote sox10+/Met+ OLCs. White arrowheads denote sox10+/Met− OLCs. Yellow dashed circle denotes boundary of the spinal cord. (B) Lateral view of metegfp zebrafish spinal cords at 48, 55, 72, and 96 hpf labeled with a Sox10 antibody. Asterisks denote examples of met+ motor neurons. Magenta-filled yellow arrowheads denote Sox10+/met+ OPCs, white arrowheads denote Sox10+/met− OLCs. Yellow dashed line denotes ventral edge of the spinal cord. (C) Percentage of OLCs that are Sox10+ and met:gfp+ in 322 μm of spinal cord at 48 hpf (n = 18), 55 hpf (n = 12), 72 hpf (n = 14), and 96 hpf (n = 10). Mean with SEM. Statistical test: one-way ANOVA with Tukey’s Multiple Comparison Test. Scale bars, 10 μm (A), 20 μm (B).