
Figure 3
- ID
- ZDB-IMAGE-211001-9
- Genes
- Publication
- Ali et al., 2021 - Met is required for oligodendrocyte progenitor cell migration in Danio rerio
- All Figures
- Figures for Ali et al., 2021
|
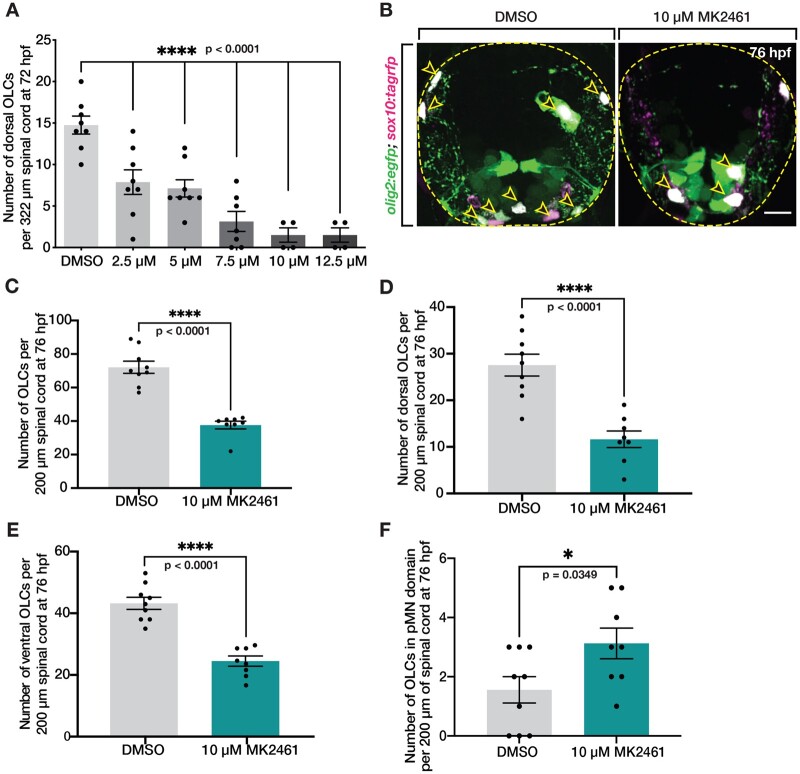
Figure 3
Met receptor inhibition decreases the number of OLCs in spinal cord. (A) Dose–response curve of the number of OLCs in the dorsal spinal cord of fish treated from 24 hpf to 3 dpf with 1% DMSO (n = 8) and 10 μM MK2461 in 1% DMSO in the following doses: 2.5 μM (n = 8), 5 μM (n = 8), 7.5 μM (n = 7), 10 μM (n = 4), and 12.5 μM (n = 8). Statistical test: one-way ANOVA with Dunnett’s Multiple Comparison Test. (B) Transverse sections of 76 hpf olig2:egfp;sox10:tagrfp larvae treated with DMSO or 10 μM MK2461 from 24 hpf to 3 dpf. Yellow open arrowheads denote sox10+/olig2+ OLCs. (C–F) Quantification of olig2+/sox10+ OLCs from 10 sequential 20 μm sections of olig2:egfp;sox10:tagrfp larvae treated with DMSO (n = 9) or MK2461 (n = 8) from 24 hpf to 3 dpf. Mean with SEM. Student’s t-test was used in C–F. Scale bar, 10 μm.