
|
Figure 1
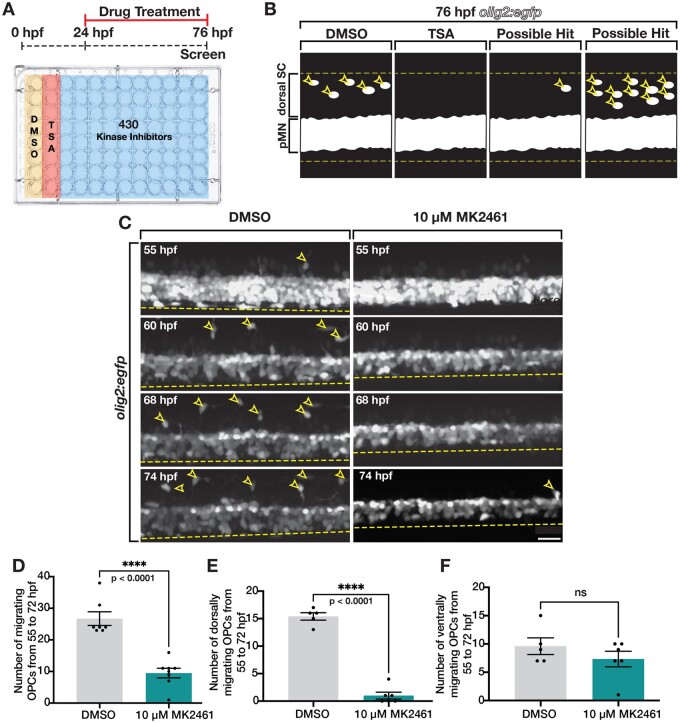
Kinase inhibitor screen identifies Met as mediator of dorsal OPC migration. (A) Schematic of kinase inhibitor screen and treatment paradigm that tested 430 kinase inhibitors for developmental OPC migration defects. Trichostatin A (TSA), which inhibits OPC specification, was used as a positive control. (B) Cartoon of a lateral view of 76 hpf olig2:egfp larvae spinal cord showing DMSO (negative control), TSA (positive control), and examples of possible hits: reduced OLCs in the dorsal spinal cord (SC) and increased OLCs in the dorsal SC. pMN denotes pMN domain. Yellow dashed lines mark the boundaries of the spinal cord and open yellow arrowheads mark dorsal OLCs. (C) Images taken from 18 h time-lapse movies of DMSO and MK2461-treated 55 hpf olig2:egfp zebrafish larvae. Yellow open arrowheads denote dorsally migrating OPCs. Yellow dashed line denotes ventral edge of the spinal cord. (D–F) Quantifications taken from time-lapse movies of DMSO (n = 7) and MK2461-treated (n = 7) larvae in (C). Mean with SEM. Student’s t-test was used in D–F. Scale bar, 20 μm.