- Title
-
Feed Restriction Modulates Growth, Gut Morphology and Gene Expression in Zebrafish
- Authors
- Purushothaman, K., Tan, J.K.H., Lau, D., Saju, J.M., Thevasagayam, N.M., Wee, C.L., Vij, S.
- Source
- Full text @ Int. J. Mol. Sci.
|
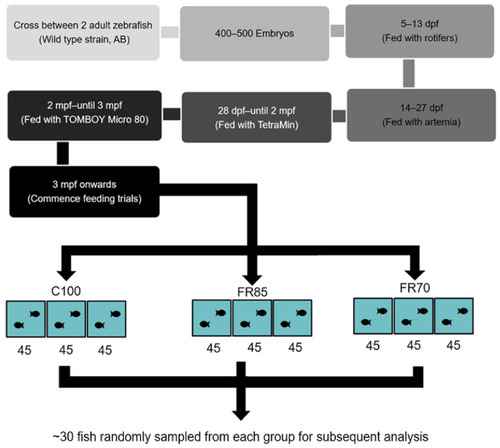
Flow chart outlining the experimental design for assessing the effect of feed restriction on zebrafish. Abbreviations: dpf: days-post-fertilization; mpf: months-post-fertilization; C100, FR85, and FR70 refer to feeding the fish to 100%, 85%, and 70% satiety, respectively; 45 refers to the number of zebrafish stocked in each experimental tank. Approximately 30 fish were sampled each week for analysis. |
|
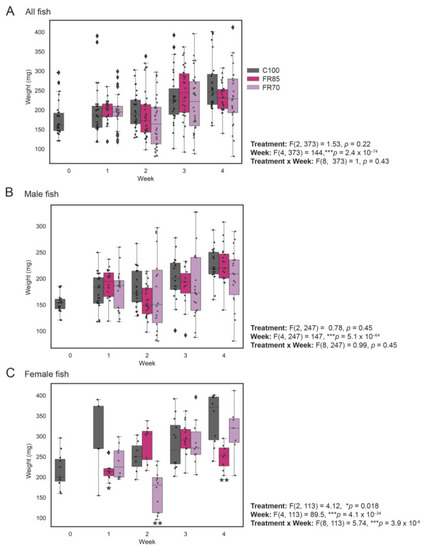
Weight profiles of zebrafish fed to visual satiety compared to feed-restricted fish (85% and 70% feeding). Feed restriction (85% and 70% feeding) was performed at 3 mpf and the weight measurements were recorded on a weekly basis for a period of 4 weeks. The combined weight of males and females (all fish), only males and only females are shown in (A–C), respectively. The box plot shows median, interquartile interval, and data range excluding outliers; each dot represents an individual fish. ♦ represents an outlier. Two-way ANOVA was used to infer the significant effects of treatment, week, or treatment by week interactions, followed by Tukey’s multiple comparison test to identify significantly different means. Means that are significantly different from Group 100% are noted with—* Padj < 0.05, ** Padj < 0.01. |
|
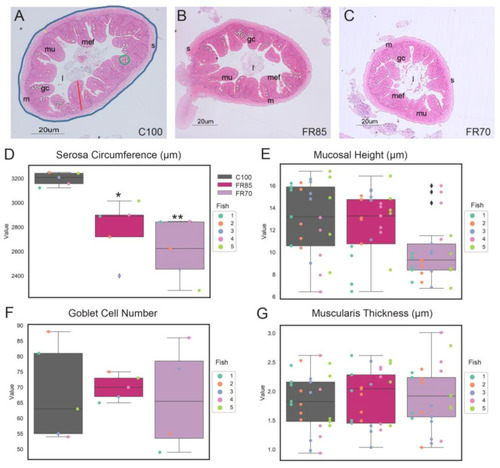
Histological analyses of feed restricted zebrafish reveal differences in some morphological characteristics. Representative transverse sections of Haematoxylin and Eosin (H&E)-stained mid-intestine from fish fed on (A) 100%, (B) 85%, and (C) 70% feed for a period of three weeks. The serosa circumference, mucosal height, muscularis thickness and goblet cell number are indicated by the blue line, red line, yellow line, and green circle, respectively. Scale bar = 20 µm. Abbreviations: serosa (s), lumen (l), mucosa (mu), muscularis (m), goblet cells (gc), and mucosal epithelial fold (mef). (D) External circumferences of serosa, (E) mucosal height, (F) goblet cell number, and (G) muscularis layer thickness were measured from sections of the midgut. The box plot shows median, interquartile interval, and data range excluding outliers; colored dots represent data from each individual fish. ♦ represents an outlier. In (E,G), multiple data points were sampled per fish. One-way ANOVA was performed between the mean of each group with the mean of the control group, followed by the Tukey Post-hoc test, adjusting for multiple comparisons. Means that are significantly different from C100 are noted with—* Padj < 0.05, ** Padj < 0.01. |
|
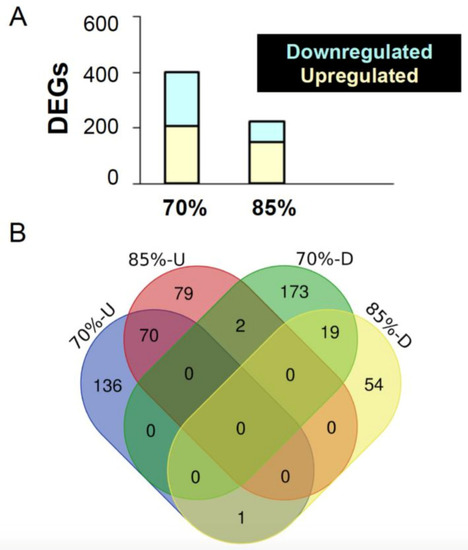
Overview of differentially expressed genes in the mid-intestine of the feed restricted groups (85% and 70%) in comparison to the 100% fed fish. (A) The graph shows the number of differentially expressed genes (DEGs) upon 70% and 85% feed restriction in comparison to the 100% fed group. (B) Venn diagrams showing the unique differentially expressed genes as well as genes shared between the two feed restricted groups (85% and 70%). |
|
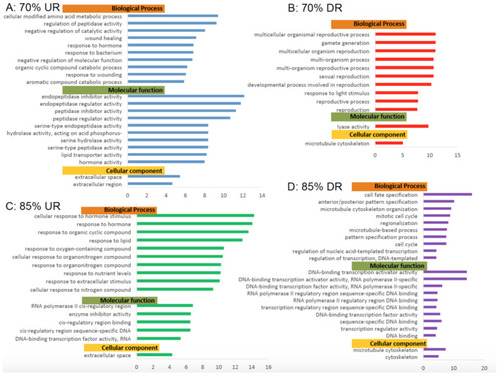
Gene Ontology Analyses of Biological Processes, Molecular Functions and Cellular components. Significantly (false discovery rate (FDR) < 0.05) enriched Gene Ontology (GO) terms from complete analysis for 70% and 85% feeding groups differentially shared genes grouped by biological process, molecular function, and cellular component. GO terms containing a minimum 100 reference genes and a fold change ≥4 or ≤4 are represented. ( |
|
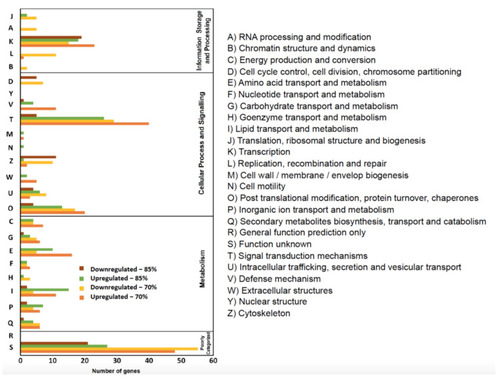
Eukaryotic Orthologous Groups (KOG) functional classification of differentially expressed genes of feed—restricted mid—intestines from two groups were categorized into four main categories: information storage and processing, metabolism, cellular processes, and signaling, and poorly categorized. |

