
Image
|
Figure Caption
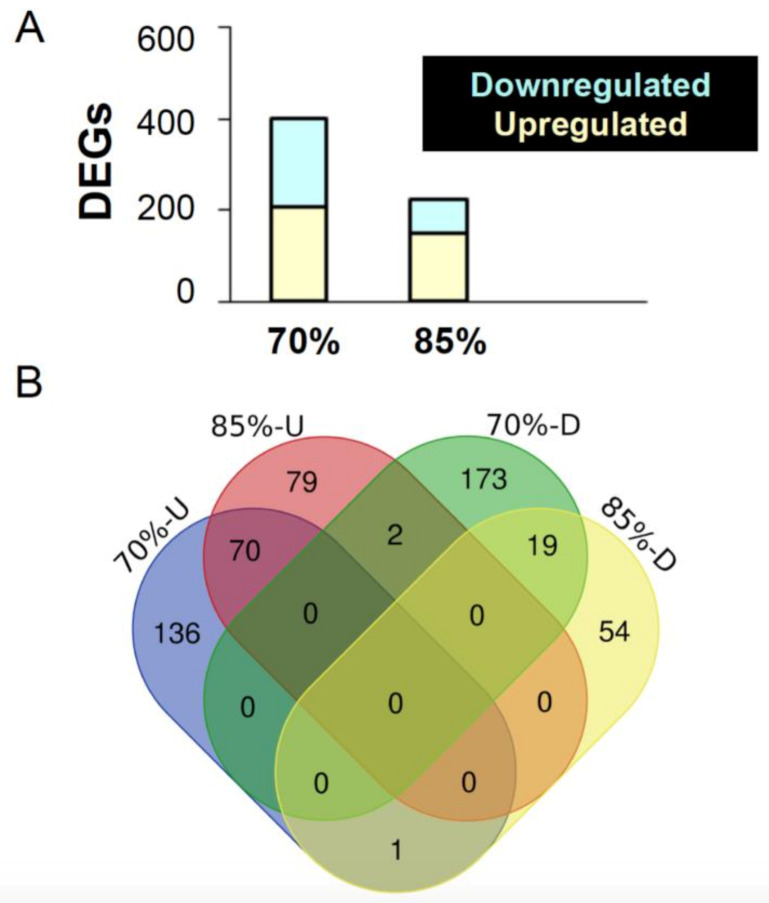
Figure 4 Overview of differentially expressed genes in the mid-intestine of the feed restricted groups (85% and 70%) in comparison to the 100% fed fish. (A) The graph shows the number of differentially expressed genes (DEGs) upon 70% and 85% feed restriction in comparison to the 100% fed group. (B) Venn diagrams showing the unique differentially expressed genes as well as genes shared between the two feed restricted groups (85% and 70%).
Acknowledgments
This image is the copyrighted work of the attributed author or publisher, and
ZFIN has permission only to display this image to its users.
Additional permissions should be obtained from the applicable author or publisher of the image.
Full text @ Int. J. Mol. Sci.