
|
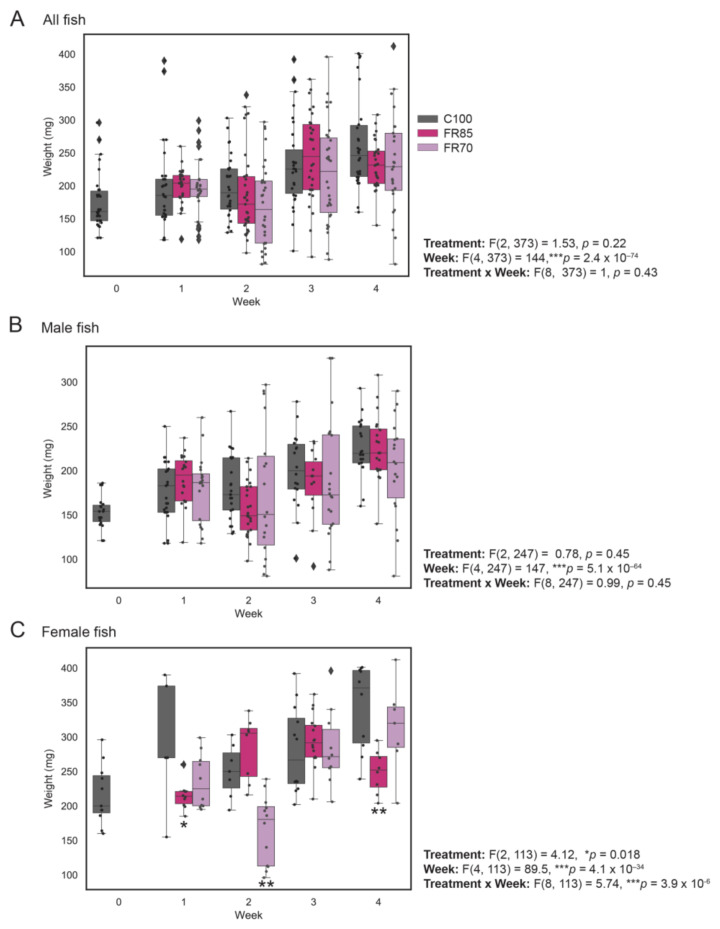
Figure 2 Weight profiles of zebrafish fed to visual satiety compared to feed-restricted fish (85% and 70% feeding). Feed restriction (85% and 70% feeding) was performed at 3 mpf and the weight measurements were recorded on a weekly basis for a period of 4 weeks. The combined weight of males and females (all fish), only males and only females are shown in (A–C), respectively. The box plot shows median, interquartile interval, and data range excluding outliers; each dot represents an individual fish. ♦ represents an outlier. Two-way ANOVA was used to infer the significant effects of treatment, week, or treatment by week interactions, followed by Tukey’s multiple comparison test to identify significantly different means. Means that are significantly different from Group 100% are noted with—* Padj < 0.05, ** Padj < 0.01.