
|
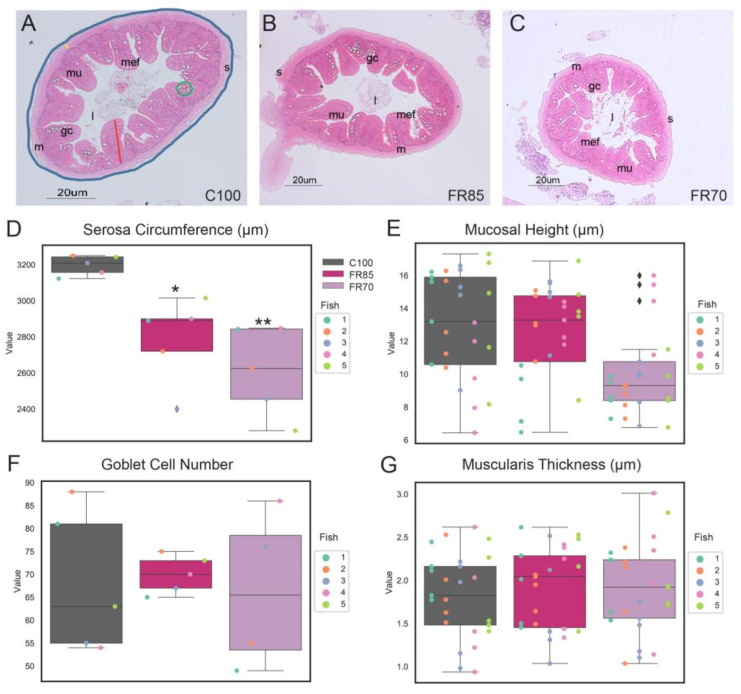
Figure 3 Histological analyses of feed restricted zebrafish reveal differences in some morphological characteristics. Representative transverse sections of Haematoxylin and Eosin (H&E)-stained mid-intestine from fish fed on (A) 100%, (B) 85%, and (C) 70% feed for a period of three weeks. The serosa circumference, mucosal height, muscularis thickness and goblet cell number are indicated by the blue line, red line, yellow line, and green circle, respectively. Scale bar = 20 µm. Abbreviations: serosa (s), lumen (l), mucosa (mu), muscularis (m), goblet cells (gc), and mucosal epithelial fold (mef). (D) External circumferences of serosa, (E) mucosal height, (F) goblet cell number, and (G) muscularis layer thickness were measured from sections of the midgut. The box plot shows median, interquartile interval, and data range excluding outliers; colored dots represent data from each individual fish. ♦ represents an outlier. In (E,G), multiple data points were sampled per fish. One-way ANOVA was performed between the mean of each group with the mean of the control group, followed by the Tukey Post-hoc test, adjusting for multiple comparisons. Means that are significantly different from C100 are noted with—* Padj < 0.05, ** Padj < 0.01.