
Image
|
Figure Caption
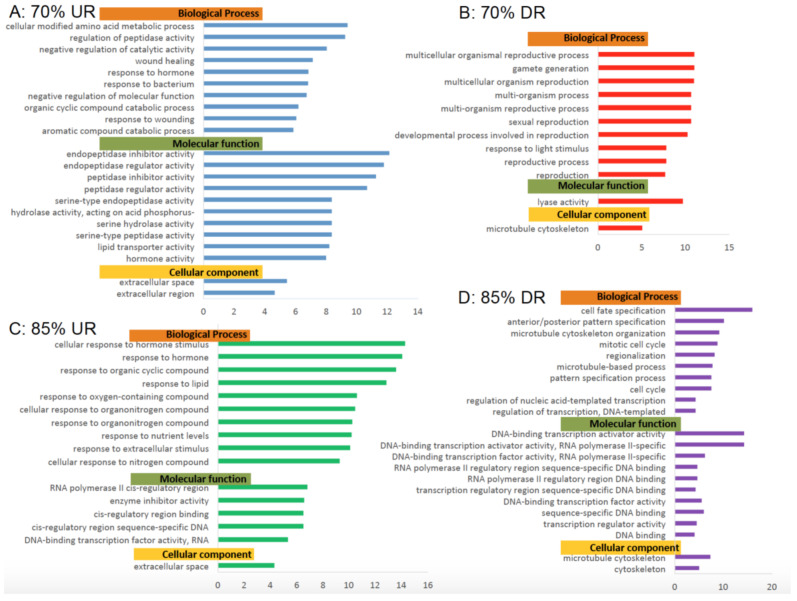
Figure 5
Gene Ontology Analyses of Biological Processes, Molecular Functions and Cellular components. Significantly (false discovery rate (FDR) < 0.05) enriched Gene Ontology (GO) terms from complete analysis for 70% and 85% feeding groups differentially shared genes grouped by biological process, molecular function, and cellular component. GO terms containing a minimum 100 reference genes and a fold change ≥4 or ≤4 are represented. (
Acknowledgments
This image is the copyrighted work of the attributed author or publisher, and
ZFIN has permission only to display this image to its users.
Additional permissions should be obtained from the applicable author or publisher of the image.
Full text @ Int. J. Mol. Sci.