
FIGURE
Figure 1
- ID
- ZDB-FIG-210310-33
- Publication
- Purushothaman et al., 2021 - Feed Restriction Modulates Growth, Gut Morphology and Gene Expression in Zebrafish
- Other Figures
- All Figure Page
- Back to All Figure Page
Figure 1
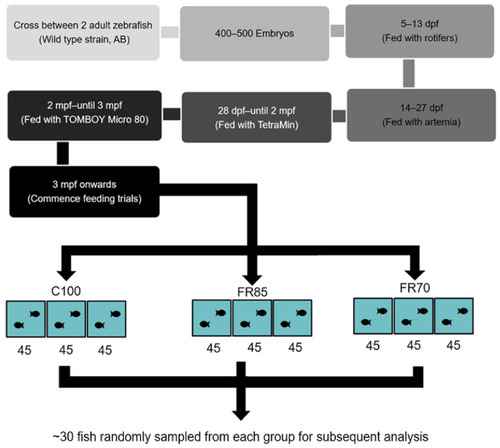
Flow chart outlining the experimental design for assessing the effect of feed restriction on zebrafish. Abbreviations: dpf: days-post-fertilization; mpf: months-post-fertilization; C100, FR85, and FR70 refer to feeding the fish to 100%, 85%, and 70% satiety, respectively; 45 refers to the number of zebrafish stocked in each experimental tank. Approximately 30 fish were sampled each week for analysis. |
Expression Data
Expression Detail
Antibody Labeling
Phenotype Data
Phenotype Detail
Acknowledgments
This image is the copyrighted work of the attributed author or publisher, and
ZFIN has permission only to display this image to its users.
Additional permissions should be obtained from the applicable author or publisher of the image.
Full text @ Int. J. Mol. Sci.