
- Title
-
Enteric nervous system can regenerate in zebrafish larva via migration into the ablated area and proliferation of neural crest-derived cells
- Authors
- Ohno, M., Nikaido, M., Horiuchi, N., Kawakami, K., Hatta, K.
- Source
- Full text @ Development
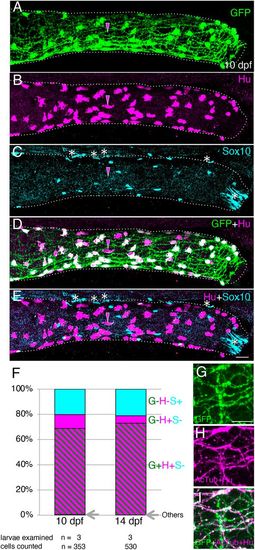
Immunostaining of intestine in the transgenic line Tg(217B; u:gfp). (A-E) 10 dpf larval distal intestine stained for GFP (A), HuC/D (Hu, B) and Sox10 (C), with merge images shown (D,E). Dotted lines outline the intestine. Images are left side views, with the anterior end positioned to the left of the image. To show the overlapping expression of GFP and HuC/D, signal intensity for each marker is enhanced (A,B,D). Magenta arrowheads mark an example of a GFP−/Hu+ cell. The white asterisks in the most distal end of the intestine indicate unidentified Sox10 signals, and other asterisks around the dorsal part of intestine mark pigment cells outside of the intestine. Scale bar: 25 µm. (F) Proportions of GFP−/Hu−/Sox10+ (G−H−S+), GFP−/Hu+/ Sox10− (G−H+S−), GFP+/Hu+/Sox10− (G+H+S−) and other (Others) cell types at 10 and 14 dpf as a percentage of all cells examined (353 and 530 cells, respectively). ‘Others’ represent one GFP+/Hu+/Sox10+ and one GFP+/Hu−/Sox10+ cell at 10 dpf, and one GFP+/Hu+/Sox10+ cell at 14 dpf. Cells were counted in the distal part of the intestine, as exemplified in A-E. Numbers of examined larvae and cells at each stage are shown below the columns. (G-I) Co-expression of GFP and acetylated tublin (AcTub) in the distal intestine at 10 dpf. Markers shown are indicated in the bottom-left corners of panels. Images are left side views, with the anterior end positioned to the left of the image. Scale bar: 10 µm. |
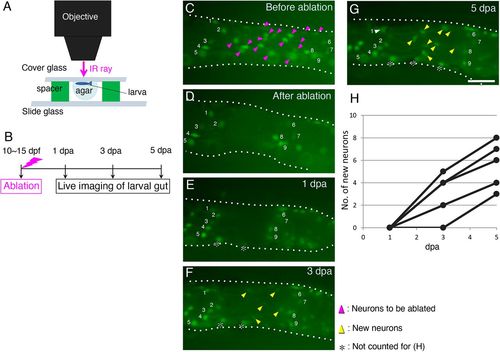
Enteric neurons marked with GFP are regenerated after ablation. (A) Schematic of the ablation equipment. An anesthetized zebrafish larva of Tg(217B; u:gfp) (10-15 dpf) was mounted in agar under a coverglass with its left side facing up toward the objective. The neurons at the second-somite level from the anus were removed by irradiating an infrared (IR) ray through the objective (see Materials and Methods for details). (B) Timeline of the experiments. After ablation, each larva was cultured and live imaged at 1, 3 and 5 dpa. (C-G) Recovery of GFP+ cells after ablation in the same larva. Cells before ablation are marked with magenta arrowheads in the posterior intestine (C), and they were removed as shown in (D). Imaging at 1 dpa (E), 3 dpa (F) and 5 dpa (G) revealed new GFP+ cells (yellow arrowheads). Numbers in each panel mark identified cells before and after regeneration. Cells marked with asterisks were not counted for the data presented in H, because these cells are located near the ventral midline of the gut tube and are likely to have been hidden behind the gut when ablating. White arrowhead in G indicates the identified neuron 1. Intestines are outlined with dotted lines. Images are left side views of the distal intestine, with the anterior end positioned to the left of the image. Scale bar: 50 µm. (H) Numbers of new GFP+ cells in the ablated areas of five larvae examined at 1, 3 and 5 dpa during regeneration. |
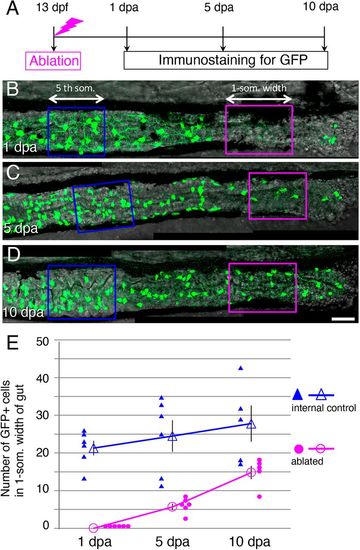
The number of GFP+ cells in the ablated area increases after ablation. (A) Timeline of the experiments. After ablation at 13 dpf, larvae were cultured and fixed at 1, 5 and 10 dpa for immunostaining. (B-D) Posterior intestines stained for GFP at 1 dpa (B) 5 dpa (C), and 10 dpa (D). The arrows and enclosed areas indicate the one-somite-width of intestine used for counting the GFP+ cells in the ablated area (magenta; ablated) and unablated (blue; internal control) area of the same larva at the second- and the fifth-somite level, respectively (see Materials and Methods for details). Images are left side views of the mid-distal intestines, with the anterior end positioned to the left of the image. Scale bar: 50 µm. (E) Number of GFP+ cells in ablated and internal control areas at 1, 5 and 10 dpa. Filled symbols indicate the numbers in individual larvae, and outline symbols indicate the mean±s.e.m. In the ablated areas, the number of GFP+ cells increased and reached ∼50% of the control level within 10 days, whereas a significant change in the number of cells was not observed in the control area during the same period (1 dpa versus 10 dpa; two-tailed unpaired t-test, P=0.2). |
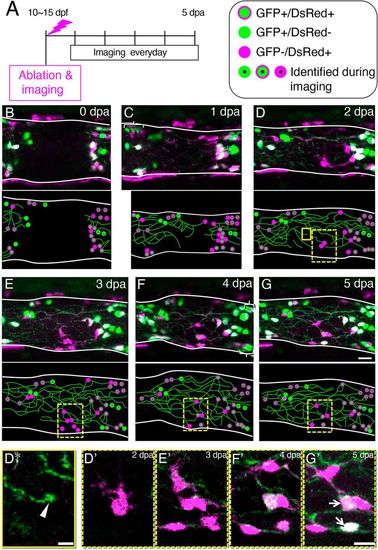
Entrance of the ENCDCs into the ablated area during the regeneration process. (A) Timeline of the experiments. (B-G) Maximum projection images of the intestine at 0 dpa (B), 1 dpa (C), 2 dpa (D), 3 dpa (E), 4 dpa (F) and 5 dpa (G), showing GFP+ cells (green) and DsRed+ cells (magenta). In the Tg(217B;u:gfp)×Tg(sox10:cre; EF1a:G/R) transgenic fish shown, enteric neurons are labeled with GFP and ENCDCs are labeled with DsRed. Schematic drawings are shown below each image. Green circles outlined with magenta, GFP+/DsRed+ cells; green circles, GFP+/DsRed− cells; magenta circles, GFP−/DsRed+ cells (referred to here as ‘Red Cells’); circles with dots represent cells identified during imaging based on their relative position and color balance of GFP and DsRed; green lines represent neurites. Some neurons are GFP+/DsRed−, probably because of mosaicism of the transgenic fish. Intestines are outlined with white lines. Images are left side views, with the anterior end positioned to the left of the image. Areas marked by brackets contain after-images of cells due to intestinal movement during confocal scanning along the z-axis. Boxes indicate regions shown enlarged in panels below. (D*) Image of the area enclosed by the yellow box in D. A growth cone-like structure at the end of a neurite is shown (white arrowhead). (D′-G′) Images of the areas enclosed dashed boxes in D (D′), E (E′), F (F′) and G (G′). Two Red cells became GFP+ (marked by arrows). Scale bars: 5 µm (D*), 10 µm (D′-G′). |
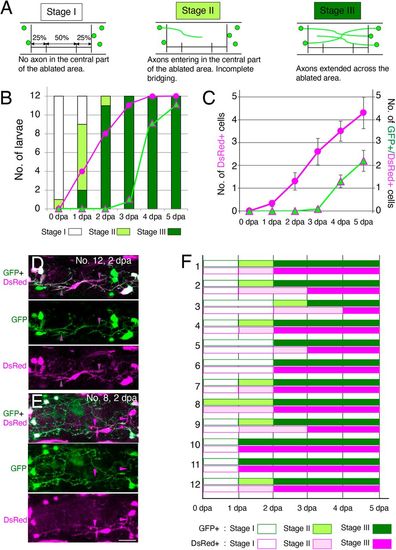
Timecourses of the appearance of axons and ENCDCs in the ablated area during regeneration. (A) The appearance of neurites in the ablated area was classified into three stages (stages I-III) based on the degree of entry into ablated areas, as described below each schema. (B) The number of larvae at each stage for 12 operated larvae across the six timepoints examined (0 to 5 dpa). Magenta circles show the number of larvae with DsRed+ cells in the central 50% of the ablated area. Green triangles with magenta lines show the number of larvae with GFP+/DsRed+ cells in the same area. Neurite bridging was completed by 3 dpa for all operated larvae, and at that time, DsRed+ cells were also found in the central part of the ablated gut in 11 of the 12 larvae. GFP+/DsRed+ cells in the central part of the ablated area were found in most larvae (9/12) at 4 dpa. (C) The average number of DsRed+ and GFP+/DsRed+ cells in 12 operated larvae at the six time points examined (0 to 5 dpa). Magenta circles show the number of DsRed+ cells in the central 50% of the ablated area. Green triangles with magenta lines show the number of GFP+/DsRed+ cells in the same area. Data are presented as the mean±s.e.m. (D,E) Two examples of Red cells that entered into the ablated area. The Red cell in D extends its processes along the GFP+ processes (indicated by magenta arrowheads with green lines), whereas the Red cell(s) in E has/have DsRed+ processes extending independently of GFP+ neurites (magenta arrowheads). Scale bar: 25 µm. (F) Stages of GFP+ and DsRed+ processes at each day after ablation for 12 larvae (1-12). GFP+ and DsRed+ processes reached the same stage with the same timing for more than half (8/12) of larvae, while DsRed+ processes showed slight delay for four samples, suggesting there is no evidence that non-neuronal processes entered the ablated area to facilitate subsequent neurite extension. |
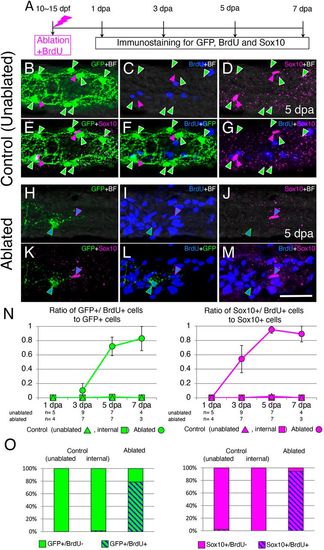
GFP+ enteric neurons and Sox10+ cells in the ablated area regenerate through induction of cell proliferation. (A) Timeline of the experiments. Ablated larvae were fixed at four time points (1, 3, 5 and 7 dpa) for immunostaining. Unablated control larvae were also fixed at the same times. (B-G) Projection images showing the staining pattern of the intestine of control unablated larvae at the level of the second somite from the end of the intestine at the 5 day timepoint. GFP+ cells (green arrowheads) and Sox10+ cells (magenta arrowheads) were BrdU−. (H-M) The staining pattern of the intestine at 5 dpa, in which enteric neurons were ablated at the level of the second somite from the end of the intestine. A Sox10+ cell (blue triangles outlined with magenta) was BrdU+. A GFP+/BrdU+ cell (blue triangles outlined with green) was observed near the Sox10+/BrdU+ cell. Single slice images are shown for ablated areas because many BrdU+ cells in the mucosal layer made it difficult to identify BrdU+ cells in the plexus layer. In B-M, markers examined are shown at the top right corner of each image (BF, brightfield). Images are left side views, with the anterior end positioned to the left of the image. Scale bar: 25 µm. (N) Ratios of GFP+/BrdU+ cells to GFP+ cells (left) and Sox10+/BrdU+ cells to Sox10+ cells (right). Ratios measured in the ablated areas are shown by circles, ratios measured at the second-somite level from the end of the intestine in unablated larvae (unablated) are shown by triangles and ratios measured at the fifth-somite level from the end of the intestine in ablated larvae (internal) are shown by squares. Numbers of larvae examined are shown below each timepoint. Data are presented as mean±s.e.m. (O) Bar graphs showing the proportion of GFP+/BrdU+ cells (left) and Sox10+/BrdU+ cells (right) at 5 dpa in control (unablated and internal) and ablated areas, expressed as a percentage of the total number of GFP+ and Sox10+ cells, respectively, in all larvae examined. |