
|
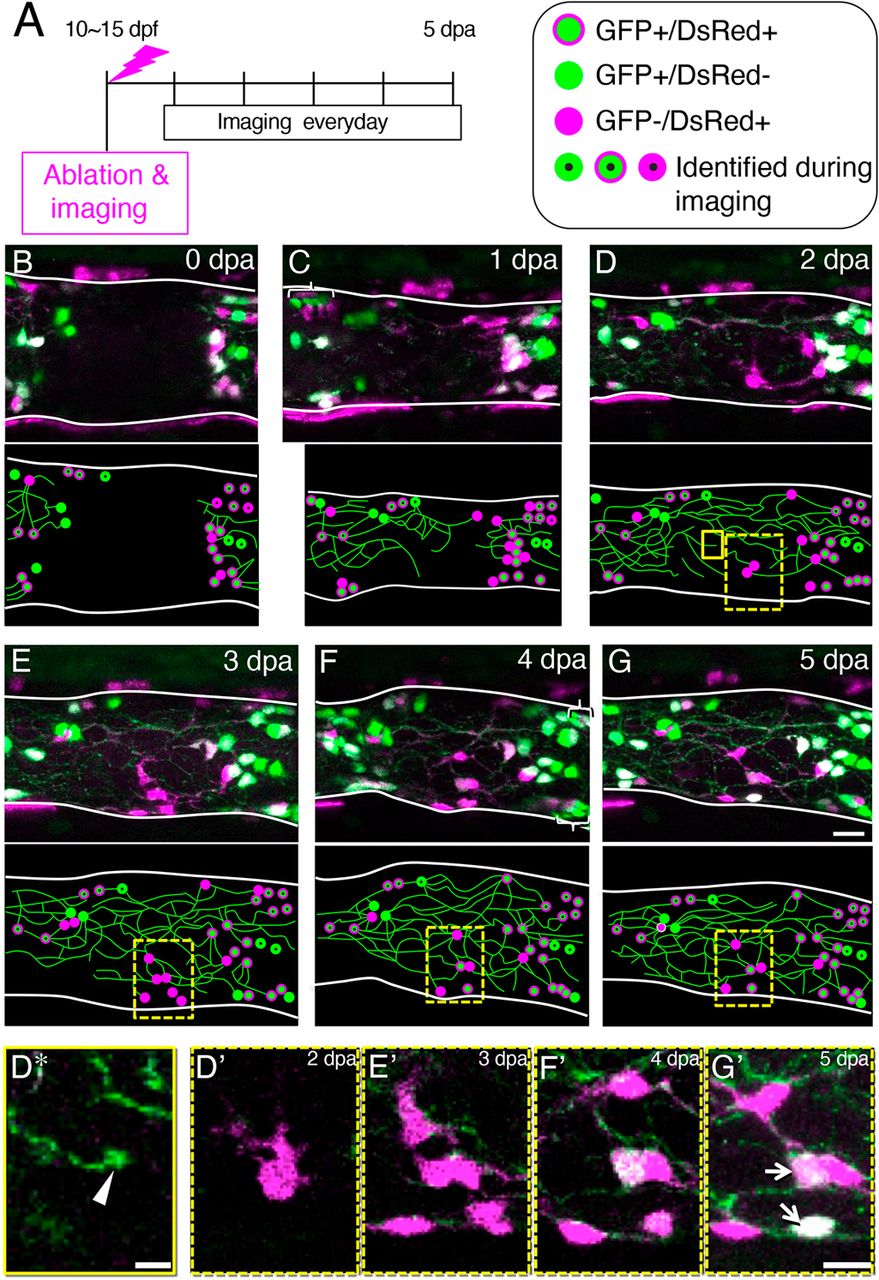
Fig. 4 Entrance of the ENCDCs into the ablated area during the regeneration process. (A) Timeline of the experiments. (B-G) Maximum projection images of the intestine at 0 dpa (B), 1 dpa (C), 2 dpa (D), 3 dpa (E), 4 dpa (F) and 5 dpa (G), showing GFP+ cells (green) and DsRed+ cells (magenta). In the Tg(217B;u:gfp)×Tg(sox10:cre; EF1a:G/R) transgenic fish shown, enteric neurons are labeled with GFP and ENCDCs are labeled with DsRed. Schematic drawings are shown below each image. Green circles outlined with magenta, GFP+/DsRed+ cells; green circles, GFP+/DsRed− cells; magenta circles, GFP−/DsRed+ cells (referred to here as ‘Red Cells’); circles with dots represent cells identified during imaging based on their relative position and color balance of GFP and DsRed; green lines represent neurites. Some neurons are GFP+/DsRed−, probably because of mosaicism of the transgenic fish. Intestines are outlined with white lines. Images are left side views, with the anterior end positioned to the left of the image. Areas marked by brackets contain after-images of cells due to intestinal movement during confocal scanning along the z-axis. Boxes indicate regions shown enlarged in panels below. (D*) Image of the area enclosed by the yellow box in D. A growth cone-like structure at the end of a neurite is shown (white arrowhead). (D′-G′) Images of the areas enclosed dashed boxes in D (D′), E (E′), F (F′) and G (G′). Two Red cells became GFP+ (marked by arrows). Scale bars: 5 µm (D*), 10 µm (D′-G′).