
|
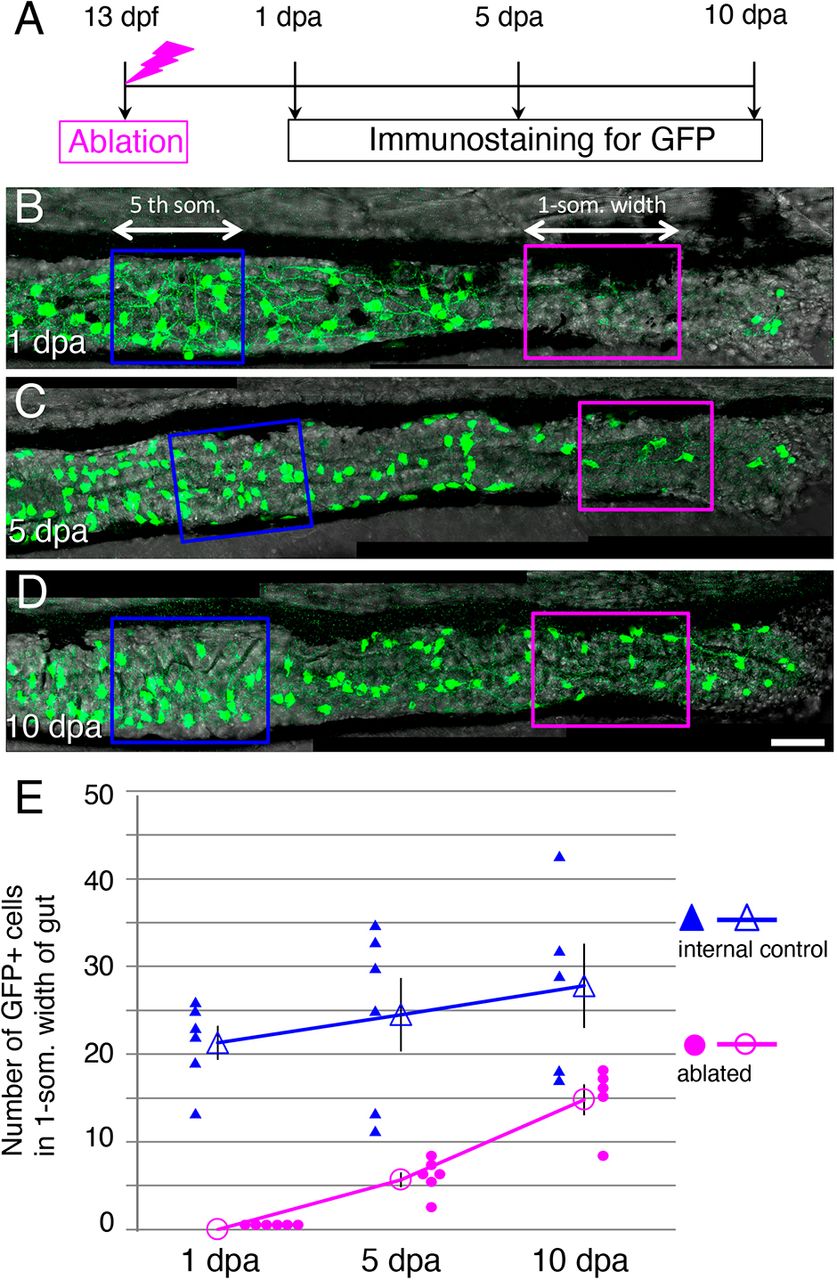
Fig. 3 The number of GFP+ cells in the ablated area increases after ablation. (A) Timeline of the experiments. After ablation at 13 dpf, larvae were cultured and fixed at 1, 5 and 10 dpa for immunostaining. (B-D) Posterior intestines stained for GFP at 1 dpa (B) 5 dpa (C), and 10 dpa (D). The arrows and enclosed areas indicate the one-somite-width of intestine used for counting the GFP+ cells in the ablated area (magenta; ablated) and unablated (blue; internal control) area of the same larva at the second- and the fifth-somite level, respectively (see Materials and Methods for details). Images are left side views of the mid-distal intestines, with the anterior end positioned to the left of the image. Scale bar: 50 µm. (E) Number of GFP+ cells in ablated and internal control areas at 1, 5 and 10 dpa. Filled symbols indicate the numbers in individual larvae, and outline symbols indicate the mean±s.e.m. In the ablated areas, the number of GFP+ cells increased and reached ∼50% of the control level within 10 days, whereas a significant change in the number of cells was not observed in the control area during the same period (1 dpa versus 10 dpa; two-tailed unpaired t-test, P=0.2).