
Fig. 6
- ID
- ZDB-FIG-210317-6
- Publication
- Ohno et al., 2020 - Enteric nervous system can regenerate in zebrafish larva via migration into the ablated area and proliferation of neural crest-derived cells
- Other Figures
- All Figure Page
- Back to All Figure Page
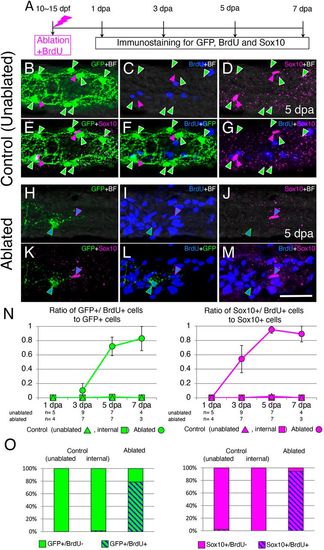
GFP+ enteric neurons and Sox10+ cells in the ablated area regenerate through induction of cell proliferation. (A) Timeline of the experiments. Ablated larvae were fixed at four time points (1, 3, 5 and 7 dpa) for immunostaining. Unablated control larvae were also fixed at the same times. (B-G) Projection images showing the staining pattern of the intestine of control unablated larvae at the level of the second somite from the end of the intestine at the 5 day timepoint. GFP+ cells (green arrowheads) and Sox10+ cells (magenta arrowheads) were BrdU−. (H-M) The staining pattern of the intestine at 5 dpa, in which enteric neurons were ablated at the level of the second somite from the end of the intestine. A Sox10+ cell (blue triangles outlined with magenta) was BrdU+. A GFP+/BrdU+ cell (blue triangles outlined with green) was observed near the Sox10+/BrdU+ cell. Single slice images are shown for ablated areas because many BrdU+ cells in the mucosal layer made it difficult to identify BrdU+ cells in the plexus layer. In B-M, markers examined are shown at the top right corner of each image (BF, brightfield). Images are left side views, with the anterior end positioned to the left of the image. Scale bar: 25 µm. (N) Ratios of GFP+/BrdU+ cells to GFP+ cells (left) and Sox10+/BrdU+ cells to Sox10+ cells (right). Ratios measured in the ablated areas are shown by circles, ratios measured at the second-somite level from the end of the intestine in unablated larvae (unablated) are shown by triangles and ratios measured at the fifth-somite level from the end of the intestine in ablated larvae (internal) are shown by squares. Numbers of larvae examined are shown below each timepoint. Data are presented as mean±s.e.m. (O) Bar graphs showing the proportion of GFP+/BrdU+ cells (left) and Sox10+/BrdU+ cells (right) at 5 dpa in control (unablated and internal) and ablated areas, expressed as a percentage of the total number of GFP+ and Sox10+ cells, respectively, in all larvae examined. |