FIGURE SUMMARY
Title

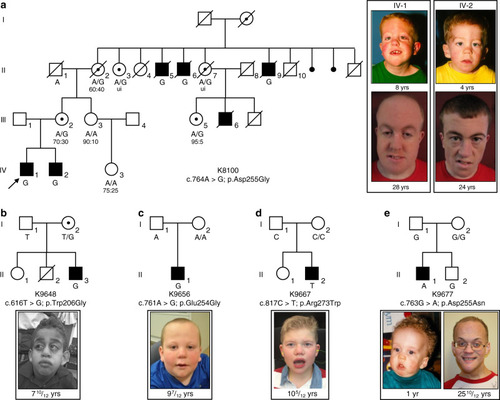
Mutations in FAM50A suggest that Armfield XLID syndrome is a spliceosomopathy

Authors
Lee, Y.R., Khan, K., Armfield-Uhas, K., Srikanth, S., Thompson, N.A., Pardo, M., Yu, L., Norris, J.W., Peng, Y., Gripp, K.W., Aleck, K.A., Li, C., Spence, E., Choi, T.I., Kwon, S.J., Park, H.M., Yu, D., Do Heo, W., Mooney, M.R., Baig, S.M., Wentzensen, I.M., Telegrafi, A., McWalter, K., Moreland, T., Roadhouse, C., Ramsey, K., Lyons, M.J., Skinner, C., Alexov, E., Katsanis, N., Stevenson, R.E., Choudhary, J.S., Adams, D.J., Kim, C.H., Davis, E.E., Schwartz, C.E.
Source
Full text @ Nat. Commun.

Missense variants in <italic>FAM50A</italic> cause XLID in five unrelated families.

ae Pedigrees of the five families reported in this study are shown, with FAM50A genotype given for each available individual. Photographs of available affected males are provided for each pedigree. For family K8100, photographs are provided for the two affected males in generation IV at ages 8 and 4 years, when the family was originally published4; new photos from the last clinical assessment (December 2017) are shown (28 and 24 years). Ratios under females II-2, III-2, III-3, III-5, and IV-3 represent X-inactivation data. Females II-3 and II-7 were uninformative (ui) at the AR locus. Circles, females; squares, males; unfilled shapes, unaffected; black filled shapes, affected; unshaded circle with black dot, carrier female as determined by FAM50A analysis or by pedigree structure; diagonal line, deceased. Male K8100-III-6 had macrocephaly, seizure disorder, bilateral ventricular enlargement, and atrophy of the left hemisphere on a pneumoencephalogram; he was unavailable for FAM50A genotyping.

<italic>fam50a</italic> KO zebrafish display central nervous system and craniofacial patterning defects.

a Representative bright field lateral images of WT and fam50a KO are shown at 3 and 5 days post-fertilization (dpf). Morphology of fam50a KO was relatively normal at 3 dpf; repeated four times. However, at 5 dpf, fam50a KO showed craniofacial abnormalities; repeated five times. Number of larvae assessed with similar results: 3 dpf, n = 56; 5 dpf, n = 44. b Fluorescent lateral images of WT and fam50a KO larvae on a Tg(huc:egfp) neuronal reporter. No difference between WT and fam50a KO was detected in the anterior structures at 2 dpf. However, at 3 dpf, a prominent reduction of GFP-positive neurons was observed in KO larvae. Number of larvae assessed with similar results: 2 dpf, n = 20; 3 dpf, n = 20. c Whole-mount in situ hybridization (WISH) of her4.1, a molecular marker of neurogenesis, indicated a depletion of neurons in fam50a KO compared to WT at 3 dpf; repeated. Number of larvae assessed with similar results: 2 dpf, n = 24; 3 dpf, n = 21. d Apoptosis markers are elevated in fam50a KO larvae at 2 dpf. Note the induction of tp53 and tp53 target genes, mdm2 and cdkn1a (p21) in the cell proliferative zone in the midbrain region fam50a KO larvae at 2 dpf; repeated. Number of larvae assessed with similar results: tp53, n = 41; mdm2, n = 52; cdkn1a, n = 39. e Representative ventral images of Alcian blue staining of cartilage structures shows severe defects in cartilage development that become apparent at 3 dpf. Meckel’s cartilage, mc; palatoquadrate, pq; ceratohyal arch, ch; and ceratobranchial arches, cb. Number of larvae assessed with similar results: 2.5 dpf, n = 28; 3 dpf, n = 21; 4.5 dpf, n = 14. For all images: anterior, left; posterior, right. Scale bars; 200 μm.

In vivo assays indicate that <italic>FAM50A</italic> missense variants confer a partial loss of function.

a Representative ventral views of craniofacial structures imaged live using the VAST BioImager in -1.4col1a1:egfp zebrafish larvae at 3 days post-fertilization (dpf). mc, Meckel’s cartilage; pq, palatoquadrate; ch, ceratohyal arch; cb, ceratobranchial arches. Red dashed lines on control image indicate the ch angle measured to quantify altered cartilage patterning in wild-type (WT) control, KO (homozygous mutants) or morphants. 5 ng morpholino (MO) and/or 150 pg of human FAM50A mRNA were injected for all assays. Scale bars, 100 μm. b Quantification of ch angle in fam50a KO, fam50a+/− (heterozygous mutant) and WT. Heterozygous and WT animals are indistinguishable; ch angle was significantly increased in fam50a KO. **** indicates p < 0.0001. ns, not significant (unpaired Student’s t-test, two-sided). See Supplementary Table 4 for exact p-values. Left to right: n = 20, 37, and 24 larvae per condition, respectively. c In vivo complementation studies indicate that FAM50A variants in XLID males are pathogenic. Quantification of ch angle as indicated by measurements of ventral images (a), and statistical comparison of variant mRNA vs WT mRNA rescue of MO effect indicates that patient-associated variants are hypomorphic (partial loss of function; red dashed box). p.Ala137Val (A136V; rs149558328) and p.Glu143Lys (E143K; rs782017549) are present in hemizygous males in gnomAD and were scored as benign; *, **, ***, **** indicate p < 0.05; 0.01; 0.001; and 0.0001, respectively. ns, not significant (unpaired Student’s t-test, two-sided). Left to right: n = 61, 78, 43, 36, 49, 32, 36, 46, 66, 69 larvae per condition, respectively; replicated. Data are presented as mean values ± standard deviation. See Supplementary Table 4 for exact p-values.

RNA-seq analysis revealed mRNA splicing defects in <italic>fam50a</italic> KO zebrafish.

a Schematic describing the RNA-seq experiment from sample preparation to data analysis. Steps 1 and 2 describe sample collection and preparation, whereas step 3 indicates the RNA data analysis and interpretation. Each replicate pool (n = 5 per genotype) contained total RNA from 20 genotype-matched larval heads at 2 days post-fertilization (dpf). fam50a+/− (heterozygous mutant). b Pie charts representing differential expression analysis results for KO vs WT. Transcripts with FDR-corrected p < 0.05 were included (Wald test, FDR-corrected with the Benjamini–Hochberg method). c Gene set enrichment analysis was performed using normalized enrichment score for KO vs WT. The top ten significantly disrupted pathways (depleted or augmented) are plotted along the x axis. Downregulated gene sets, orange; upregulated gene sets, blue. p-values (FDR-corrected) are indicated in parentheses (Kolmogorov–Smirnov test). d Pie chart representing percentage of alternative splicing events (by category) that are enriched in fam50a KO. p < 0.05, likelihood-ratio test with FDR correction. e Pie chart representing the distribution of GO terms impacted by discrete alternative splicing events (by category) in fam50a KO. p < 0.05, Fisher’s exact test.

Major spliceosome effectors are upregulated in <italic>fam50a</italic> KO zebrafish.

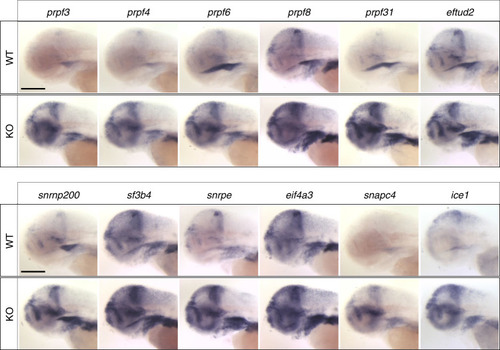
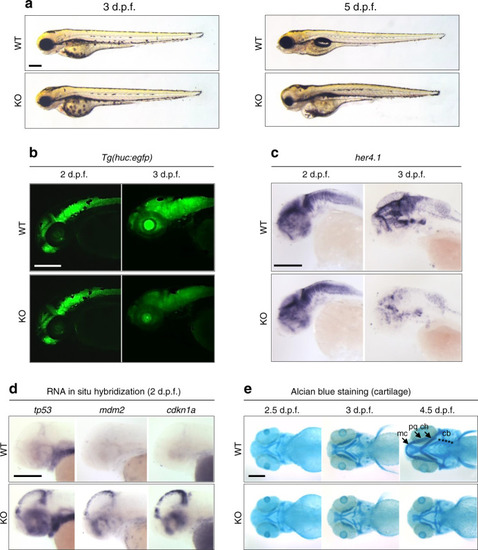
Representative lateral images of whole-mount in situ hybridization performed on 3 day post-fertilization larvae validate RNA-seq data (Table 2) from fam50a KO (homozygous mutant) vs wild-type (WT). Number of embryos assessed with similar results: prpf3, n = 11; prpf4, n = 10; prpf6, n = 11; prpf8, n = 10; prpf31, n = 11; eftud2, n = 10; snrnp200, n = 11; sf3b4, n = 11; snrpe, n = 11; eif4a3, n = 9; snapc4, n = 11; ice1, n = 10. Scale bars; 200 μm.

FAM50A interacts with U5 and C-complex proteins.

a Schematic representation of the two-step splicing reaction (adapted from ref. 70). EFTUD2 (U5); FAM50A and DDX41 (C-complex). b Graphical representation of semi-native co-immunoprecipitation assay. Candidate interactors were overexpressed in U-87 cells, harvested in immunoprecipitation (IP) lysis buffer at 60 h post-transfection and immunoprecipitated with anti-FAM50A antibody. The interaction partners were detected in IP lysate using anti-V5 and anti-FAM50A antibodies, respectively. c, d Western blot of proteins after co-immunoprecipitation. Top: total protein lysate input (50 μg/lane) was migrated on 4–15% polyacrylamide gels to detect EFTUD2 (c) or DDX41 (d) using anti-V5 mouse monoclonal antibody. GAPDH was used as loading control. Bottom: Anti-FAM50A antibody was used to immunoprecipitate native FAM50A protein in total input lysate of 2.3 mg/condition (c) or 3.5 mg/condition (d). The IP lysate was separated in two parts (20% and 80%) and migrated independently on 4–15% polyacrylamide gels. The proteins of interest with predicated band sizes are indicated with black arrows. Plus and minus signs indicate presence and absence of relevant plasmids, respectively. EFTUD2 and DDX41 were detected in independent experiments using protein lysates derived from replicate batches of U-87 cells.

ZFIN is incorporating published figure images and captions as part of an ongoing project. Figures from some publications have not yet been curated, or are not available for display because of copyright restrictions.

EXPRESSION / LABELING:
Gene:
Antibody:
Fish:
Anatomical Terms:
Stage Range: Sphere to Protruding-mouth

ZFIN is incorporating published figure images and captions as part of an ongoing project. Figures from some publications have not yet been curated, or are not available for display because of copyright restrictions.

ZFIN is incorporating published figure images and captions as part of an ongoing project. Figures from some publications have not yet been curated, or are not available for display because of copyright restrictions.

EXPRESSION / LABELING:
Genes:
Fish:
Anatomical Term:
Stage Range: Long-pec to Protruding-mouth
PHENOTYPE:
Fish:
Observed In:
Stage: Protruding-mouth

ZFIN is incorporating published figure images and captions as part of an ongoing project. Figures from some publications have not yet been curated, or are not available for display because of copyright restrictions.

ZFIN is incorporating published figure images and captions as part of an ongoing project. Figures from some publications have not yet been curated, or are not available for display because of copyright restrictions.

ZFIN is incorporating published figure images and captions as part of an ongoing project. Figures from some publications have not yet been curated, or are not available for display because of copyright restrictions.

EXPRESSION / LABELING:
Genes:
Fish:
Anatomical Term:
Stage: Protruding-mouth
PHENOTYPE:
Fish:
Observed In:
Stage: Protruding-mouth

ZFIN is incorporating published figure images and captions as part of an ongoing project. Figures from some publications have not yet been curated, or are not available for display because of copyright restrictions.

ZFIN is incorporating published figure images and captions as part of an ongoing project. Figures from some publications have not yet been curated, or are not available for display because of copyright restrictions.

Acknowledgments
This image is the copyrighted work of the attributed author or publisher, and ZFIN has permission only to display this image to its users. Additional permissions should be obtained from the applicable author or publisher of the image. Full text @ Nat. Commun.