
- Title
-
GFP expression pattern in pituitary and gonads under the control of nuclear progesterone receptor promoter in transgenic zebrafish
- Authors
- Huang, J., Zhang, T.T., Jiang, K., Hong, W.S., Chen, S.X.
- Source
- Full text @ Dev. Dyn.
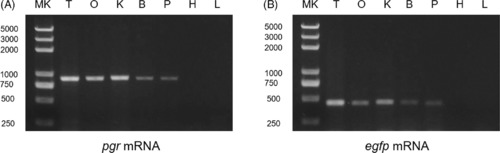
The gene expression of pgr and egfp in the Tg(pgr:eGFP) zebrafish. The tissue expression pattern of the endogenous pgr gene (A) and egfp gene (B) was assessed on reverse‐transcribed total RNA by PCR on zebrafish transgenic lines. The pituitary sample was pooled from 20 fish, and except the ovary, other tissues were collected from the same adult fish. B, brain; eGFP, enhanced green fluorescent protein; H, heart; K, kidney; L, liver; MK, marker; O, ovary; P, pituitary; pgr, progesterone receptor; T, testis |
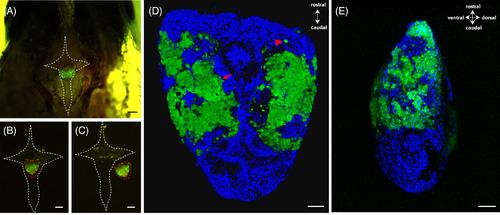
Cellular localization of green fluorescent protein (GFP) under the control of pgr promoter in the pituitary. A, The pituitary expressing GFP signals laid within a hypophyseal fossa. The white dash line indicated a cross‐shaped bone containing the pituitary. B, Dissected cross‐shaped bone (white dash line) containing the pituitary (red dash line). C, The intact pituitary (red dash line) was collected by breaking the bone (white dash line). D, Dorsal and, E, side view of the pituitary indicated the expression of GFP in the proximal pars distalis (PPD), and most of the GFP‐positive cells normally formed aggregates (red arrow), whereas a few were scattered as single cells (red arrowhead). The blue fluorescence represented the nucleus which was stained by Hoechst33342. Scale bars = 200 μm (A, B, C) and 50 μm (D, E). Pgr, progesterone receptor |
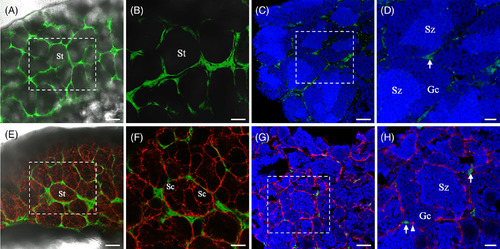
Cellular localization of green fluorescent protein (GFP) under the control of pgr promoter in testis. Intact (A, B) and cryosection (C, D) of testis of the Tg(pgr:eGFP) showed GFP signals at intertubular compartments. In Intact (E, F) and cryosection (G, H) of testis of the Tg(pgr:egfp/gsdf:nfsB‐mCherry) showed GFP signals and mCherry signals presented at intertubular compartments and spermatogenic cysts, respectively. Note that there was no colocalization of GFP and mCherry signals in testis. B, D, F, and H correspond to a higher magnification of the quadrangle area indicated by the dash line in A, C, E, and G, respectively. The blue fluorescence represented the nucleus which was stained by Hoechst33342. Gc, germ cell; eGFP, enhanced green fluorescent protein; Pgr, progesterone receptor; Sc, spermatogenic cysts; St, spermatogenic tubules; Sz, spermatozoa; white arrow, Leydig cell; white arrowhead, Sertoli cells. Scale bars = 100 μm (A, E), 50 μm (B, C, F, G), and 20 μm (D, H). |
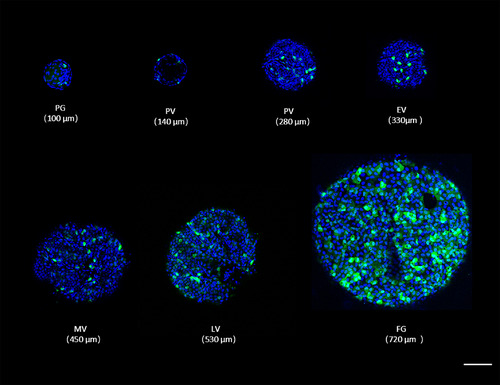
Cellular localization of green fluorescent protein (GFP) under the control of pgr promoter in ovarian follicles during folliculogenesis in Tg(pgr:eGFP). The number of GFP expressing cells increases during folliculogenesis. The diameter of the ovarian follicle was indicated within brackets. The blue fluorescence represented the nucleus which is stained by Hoechst33342. Scale bars = 100 μm. eGFP, enhanced green fluorescent protein; EV, early‐vitellogenic; FG, full‐grown stage; LV, late‐vitellogenic; MV, mid‐vitellogenic; PG, primary growth; Pgr, progesterone receptor; PV, pre‐vitellogenic |
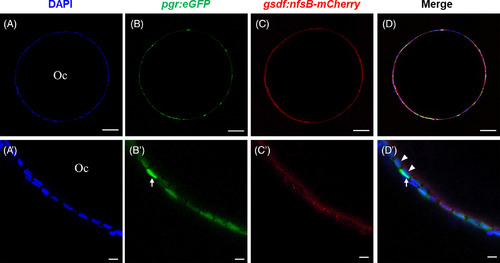
Cellular localization of green fluorescent protein (GFP) under the control of pgr promoter in ovarian follicles layer in Tg(pgr:egfp/gsdf:nfsB‐mCherry). The ovarian follicle consisted of an oocyte and a follicle cell layer (A, A′) which showed both GFP (B, B′) and mCherry (C, C′) signals. Most of GFP‐positive cells expressed mCherry signals (D), and located at inner follicle layer (D′). A few of GFP‐positive cells without mCherry signals showed strong GFP signals (B′, D′) and located at outer follicle layer (D′). The blue fluorescence represented the nucleus which is stained by Hoechst33342. Oc, oocyte; white arrow, thecal cell; white arrowhead, granulosa cell. Scale bars = 10 μm. Pgr, progesterone receptor |
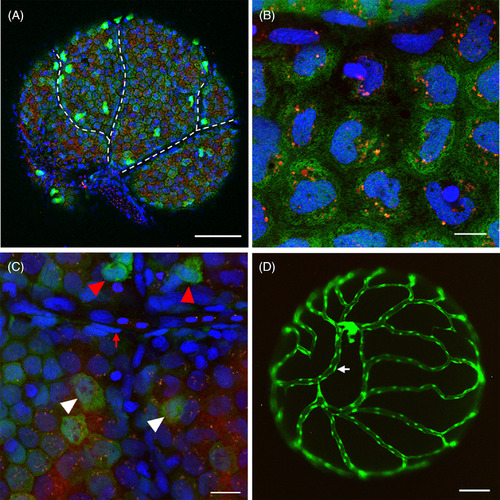
Direct observation of the surface of intact ovarian follicles in Tg(pgr:egfp/gsdf:nfsB‐mCherry) and Tg(fli:egfp). A, Direct observation of the intact ovarian follicle showed almost all granulosa cells expressing both mCherry and green fluorescent protein (GFP) signals, and a few cells exhibiting strong GFP signals. The dash line indicated a network of interconnected, unstained (dark) channels without cells presenting. B, Granulosa cells expressed both mCherry and GFP signals. Noted mCherry signals present as a few spots inside granulosa cells. C, Non‐granulosa cells only exhibited strong GFP signals (red arrow head) or without GFP/mCherry signals (red arrow). White arrow head indicated granulosa cells. D, Blood vessel nest on the surface of the ovarian follicle in Tg(fli:egfp). The white arrow indicated the vascular endothelial cell. The blue fluorescence represented the nucleus which was stained by Hoechst33342. Scale bars = 100 μm (A, D), 20 μm, C, and10 μm, B. Pgr, progesterone receptor |
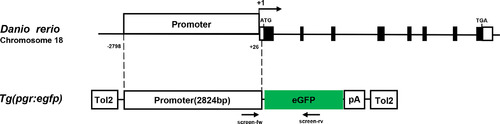
Schematic representation of the zebrafish pgr gene structure and transgene construct design. The zebrafish pgr gene is located on chromosome 18 which has eight exons. The proximal 2824 bp promoter region of the pgr gene was placed upstream to the open reading frame of the enhanced green fluorescent protein. In addition, the transgene was franked by Tol2 sites. The black box represents exons; pA, SV40 poly(A) signal. Pgr, progesterone receptor |