
Fig. 3
- ID
- ZDB-FIG-210203-11
- Publication
- Huang et al., 2020 - GFP expression pattern in pituitary and gonads under the control of nuclear progesterone receptor promoter in transgenic zebrafish
- Other Figures
- All Figure Page
- Back to All Figure Page
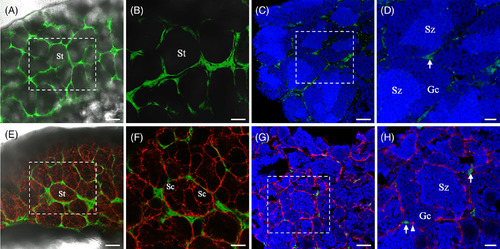
Cellular localization of green fluorescent protein (GFP) under the control of pgr promoter in testis. Intact (A, B) and cryosection (C, D) of testis of the Tg(pgr:eGFP) showed GFP signals at intertubular compartments. In Intact (E, F) and cryosection (G, H) of testis of the Tg(pgr:egfp/gsdf:nfsB‐mCherry) showed GFP signals and mCherry signals presented at intertubular compartments and spermatogenic cysts, respectively. Note that there was no colocalization of GFP and mCherry signals in testis. B, D, F, and H correspond to a higher magnification of the quadrangle area indicated by the dash line in A, C, E, and G, respectively. The blue fluorescence represented the nucleus which was stained by Hoechst33342. Gc, germ cell; eGFP, enhanced green fluorescent protein; Pgr, progesterone receptor; Sc, spermatogenic cysts; St, spermatogenic tubules; Sz, spermatozoa; white arrow, Leydig cell; white arrowhead, Sertoli cells. Scale bars = 100 μm (A, E), 50 μm (B, C, F, G), and 20 μm (D, H). |