
Fig. 6
- ID
- ZDB-FIG-210203-14
- Publication
- Huang et al., 2020 - GFP expression pattern in pituitary and gonads under the control of nuclear progesterone receptor promoter in transgenic zebrafish
- Other Figures
- All Figure Page
- Back to All Figure Page
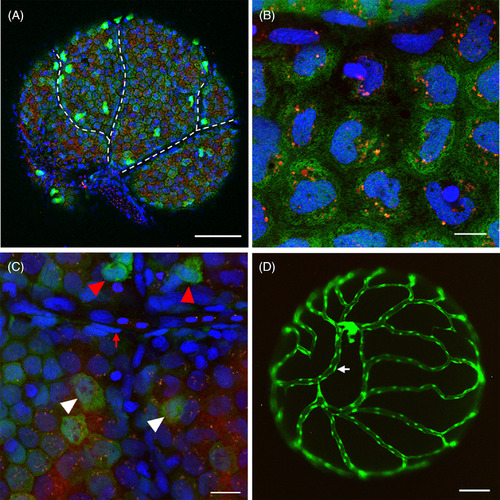
Direct observation of the surface of intact ovarian follicles in Tg(pgr:egfp/gsdf:nfsB‐mCherry) and Tg(fli:egfp). A, Direct observation of the intact ovarian follicle showed almost all granulosa cells expressing both mCherry and green fluorescent protein (GFP) signals, and a few cells exhibiting strong GFP signals. The dash line indicated a network of interconnected, unstained (dark) channels without cells presenting. B, Granulosa cells expressed both mCherry and GFP signals. Noted mCherry signals present as a few spots inside granulosa cells. C, Non‐granulosa cells only exhibited strong GFP signals (red arrow head) or without GFP/mCherry signals (red arrow). White arrow head indicated granulosa cells. D, Blood vessel nest on the surface of the ovarian follicle in Tg(fli:egfp). The white arrow indicated the vascular endothelial cell. The blue fluorescence represented the nucleus which was stained by Hoechst33342. Scale bars = 100 μm (A, D), 20 μm, C, and10 μm, B. Pgr, progesterone receptor |