
Image
|
Figure Caption
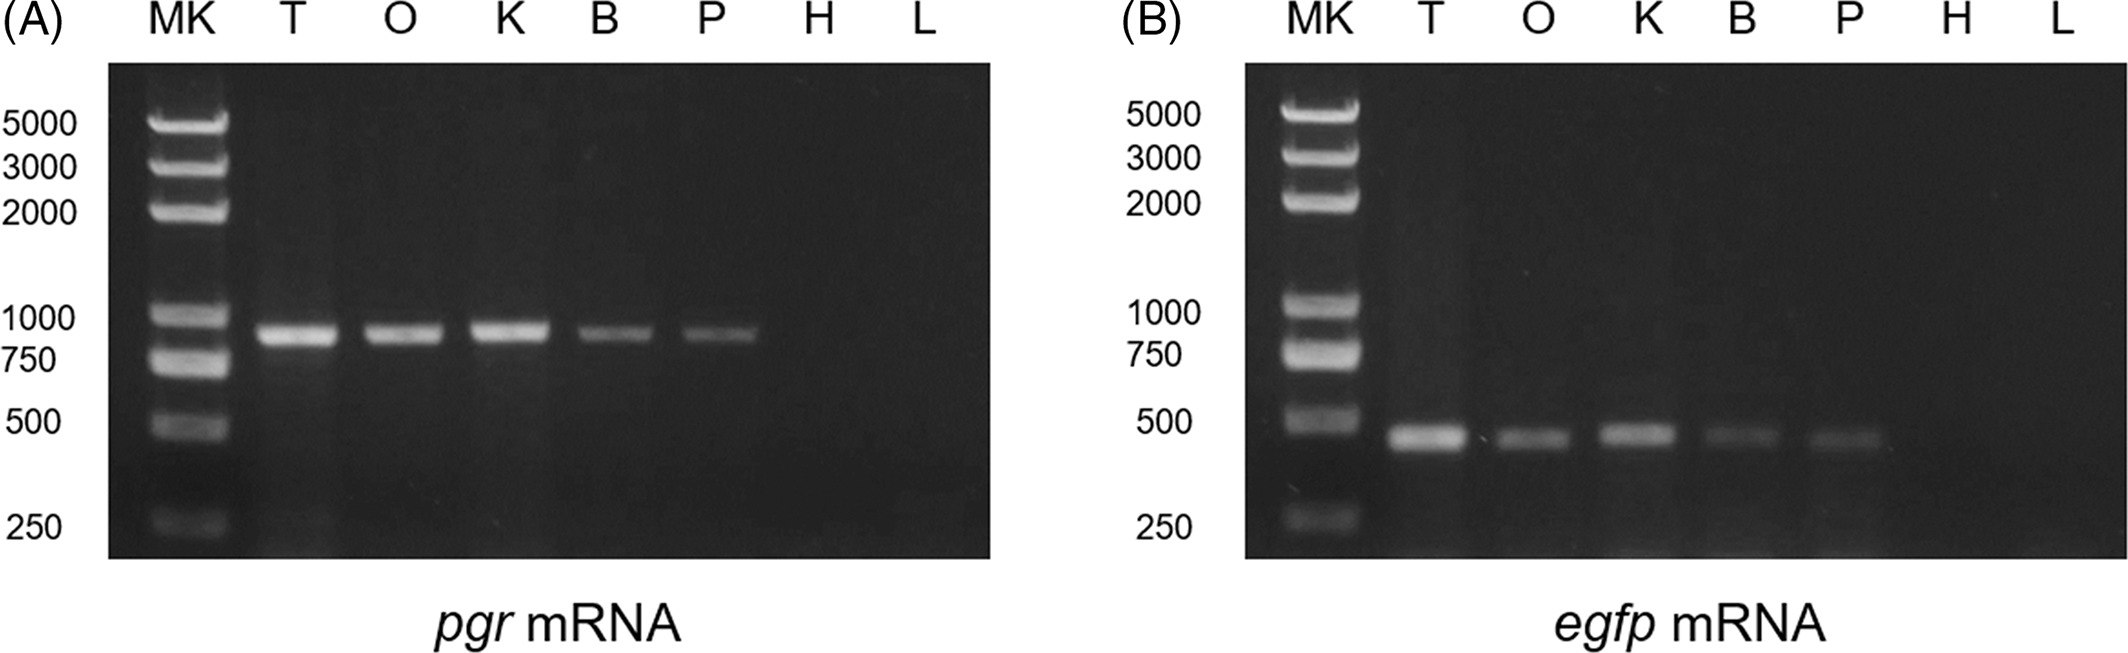
Fig. 1 The gene expression of pgr and egfp in the Tg(pgr:eGFP) zebrafish. The tissue expression pattern of the endogenous pgr gene (A) and egfp gene (B) was assessed on reverse‐transcribed total RNA by PCR on zebrafish transgenic lines. The pituitary sample was pooled from 20 fish, and except the ovary, other tissues were collected from the same adult fish. B, brain; eGFP, enhanced green fluorescent protein; H, heart; K, kidney; L, liver; MK, marker; O, ovary; P, pituitary; pgr, progesterone receptor; T, testis
Acknowledgments
This image is the copyrighted work of the attributed author or publisher, and
ZFIN has permission only to display this image to its users.
Additional permissions should be obtained from the applicable author or publisher of the image.
Full text @ Dev. Dyn.