- Title
-
Zebrafish can regenerate endoskeleton in larval pectoral fin but the regenerative ability declines
- Authors
- Yoshida, K., Kawakami, K., Abe, G., Tamura, K.
- Source
- Full text @ Dev. Biol.
|
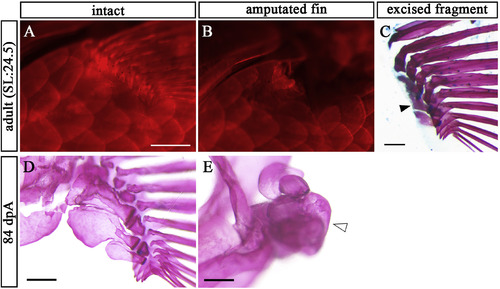
Endoskeleton of pectoral fin cannot be regenerated in adult zebrafish. (A) Intact pectoral fin in adult zebrafish stained with AR (B) Post-amputation pectoral fin in the adult zebrafish stained with AR. (C) Lateral view of the amputated fragment of pectoral fin in B stained with AR and AB. Solid arrowhead indicates remnants of prs. (D, E) Pectoral fin skeletons of intact (D) and at 84 dpA (E). Open arrowhead points to volume-enlarged endoskeleton. Scale bars: 200 μm. PHENOTYPE:
|
|
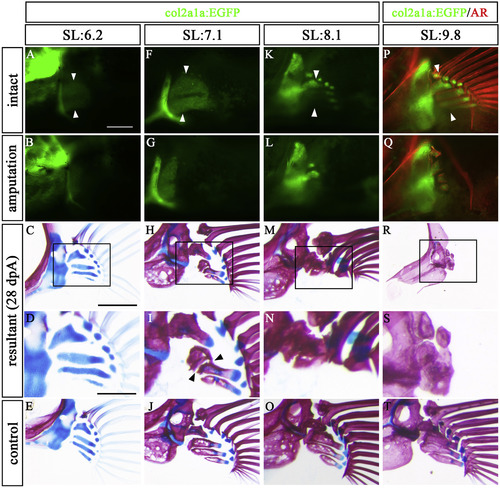
Regeneration state differs by developmental stage. Developing pectoral fins in col2a1a:EGFP were amputated, and the fish were kept for 28 days. Pectoral fins of col2a1a:EGFP fish with 6.2 mm SL (A–E), 7.1 mm SL (F–J), and 8.1 mm SL (K–O) were amputated. (P–T) col2a1a:EGFP pectoral fin of 9.8 mm SL zebrafish was stained with AR and amputated. (A, F, K, P) Intact pectoral fins before amputation. (B, G, L, Q) Post-amputation pectoral fins at 0 dpA. (C, H, M, R) At 28 dpA, pectoral fin skeletons stained with AR and AB. (D, I, N, S) Magnified views of C, H, M, and R, respectively. (E, J, O, T) Control pectoral fins on the contralateral side of the 28 dpA specimens. These pictures are flipped horizontally. White arrowheads indicate amputation site. Black arrowheads indicate the site of disconnection between distal and proximal prs. Scale bars: 200 μm in A, C, 100 μm in D. |
|
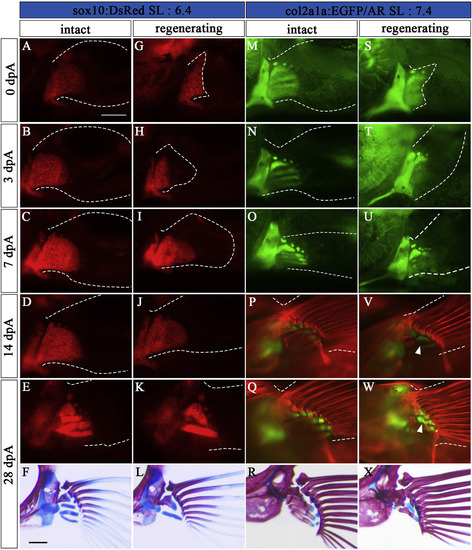
Regeneration process of Type 1. (A–L) Pectoral fins of sox10:DsRed zebrafish (SL: 6.4). (M–X) Pectoral fins of col2a1a:EGFP zebrafish (SL: 7.4). (A, M) Intact pectoral fins before amputation. (B-E, N-Q) Contralateral unamputated pectoral fins at 3 dpA (B, N), 7 dpA (C, O), 14 dpA (D, P), and 28 dpA (E, Q). These pictures are flipped horizontally. (G-K, S–W) Amputated pectoral fins at 0 dpA (G, S), 3 dpA (H, T), 7 dpA (I, U), 14 dpA (J, V), and 28 dpA (K, W). White arrowheads in V, and W indicate newly formed prs. (F, L, R, X) Pectoral fin skeleton of each sample stained with AR and AB at 28 dpA; L and X show typical Type 1 phenotypes. The pictures in F and R are flipped horizontally. White dotted lines show the circumference of the pectoral fin. Scale bars: 200 μm. |
|
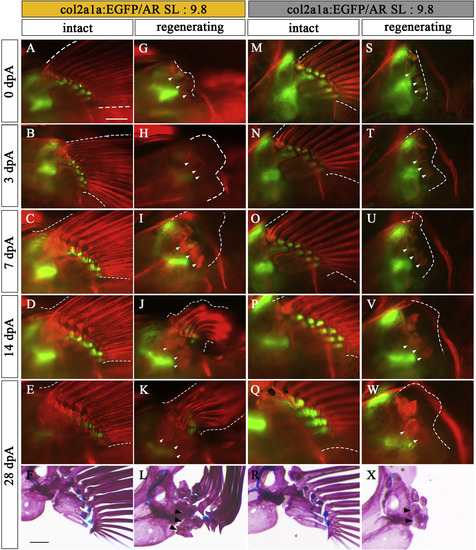
Regeneration process of Type 2 and Type 3. Pectoral fins of col2a1a:EGFP specimens (SL: 9.8) showing typical Type 2 (A–L) and Type 3 (M–X) phenotypes. (A, M) Intact pectoral fins before amputation. (B-E, N-Q) Contralateral unamputated pectoral fins at 3 dpA (B, N), 7 dpA (C, O), 14 dpA (D, P), and 28 dpA (E, Q). These pictures are flipped horizontally. (G-K, S–W) Amputated pectoral fins at 0 dpA (G, S), 3 dpA (H, T), 7 dpA (I, U), 14 dpA (J, V), and 28 dpA (K, W). White arrowheads in U, V, and W indicate newly formed pr. (F, L, R, X) Pectoral fin skeleton of each sample stained with AR and AB at 28 dpA; L and X show typical Type 2 (L) and Type 3 (X) phenotypes, respectively. White dotted lines show the circumference of the pectoral fin. White arrowheads and black arrowheads show remnants of prs in pectoral fins. Scale bars: 200 μm. |
|
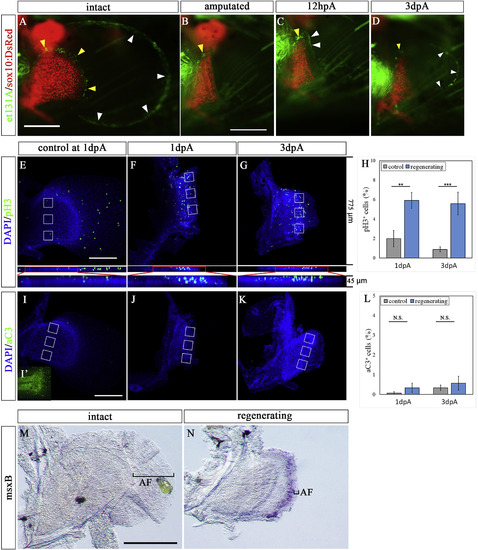
The expression pattern of et131A, phospho-histone-H3, active Caspase 3, and msxB in amputated pectoral fin. (A–D) Pectoral fin of et131A;sox10:DsRed zebrafish. (A) Pre-amputation pectoral fin. (B–D) Amputated fin at 0 dpA (B), 12 hpA (C), and 3 dpA (D). White and yellow arrowheads indicate expression of UAS:EGFP of et131A in the epithelium and mesenchyme in the pectoral fin, respectively. (E–G) Expression pattern of phospho-histone-H3 in intact and regenerating pectoral fin; control contralateral fin at 1 dpA (E), amputated fin at 1 dpA (F) and at 3 dpA (G). Lower panels in E-G show compacted Z-stack images. (H) The proportion of pH3-positive cells near the amputation plane. This proportion was calculated from the number of pH3-positive cells in 3 regions of 100 cells in the areas enclosed in white boxes. White boxes in the control fins were positioned on the regions corresponding to those in the amputated fins where the pH3 signals were measured. Error bars are the mean SEM. (I–K) Expression pattern of active Caspase3 (aC3) in intact and regenerating pectoral fin with control contralateral fin at 1 dpA (I) and tail region of the same sample as the positive control of staining (I′), and amputated fin at 1 dpA (J) and at 3 dpA (K). (L) The proportion of aC3-positive cells near the amputation plane. This proportion was calculated from the number of aC3-positive cells in three regions of 100 cells in the areas enclosed in white boxes. White boxes in the control fins were positioned on the regions corresponding to those where the aC3 signals were measured in the amputated fins. Error bars indicate mean SEM. (MaC3-N) Expression pattern of msxB in intact contralateral (M) and regenerating (N) pectoral fins at 3 dpA. Black brackets indicate the area of apical fold (AF). The photo in M is horizontally flipped. Mean values ± SEM, ∗P < 0.05, ∗∗∗P < 0.001. Scale bars: 200 μm in A, E, and I and 100 μm in M. |
|
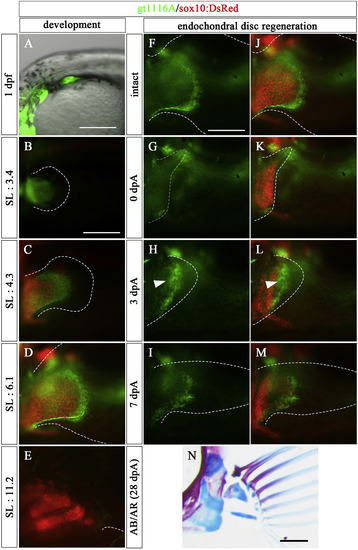
Expression patterns of gt1116A in pectoral fin development and Type 1 regeneration (5.0–7.0 mm SL larvae). (A–E) Expression pattern of UAS:EGFP in the pectoral fin of a gt1116A transgenic fish observed at embryonic (1 dpf) and post-hatching stages (SL: 3.4, 4.3, 6.1, and 11.2 mm) with observation of chondrocytes using sox10:DsRed. (F–N) The amputated pectoral fin at the middle of endochondral disc in a gt1116A transgenic fish. (F–I) Expression pattern of UAS:EGFP of gt1116A. (J–M) Merged images of expression pattern of the UAS:EGFP and sox10:DsRed. White arrowheads show re-expression of UAS:EGFP at 3 dpA. (N) the pectoral fin skeletons stained with AR and AB at 28 dpA. Dashed lines indicate the outline of fins and the UAS:EGFP-positive mesenchymal cells in the regenerated region, respectively. Scale bars: 200 μm in A, B, F, and N. |
|
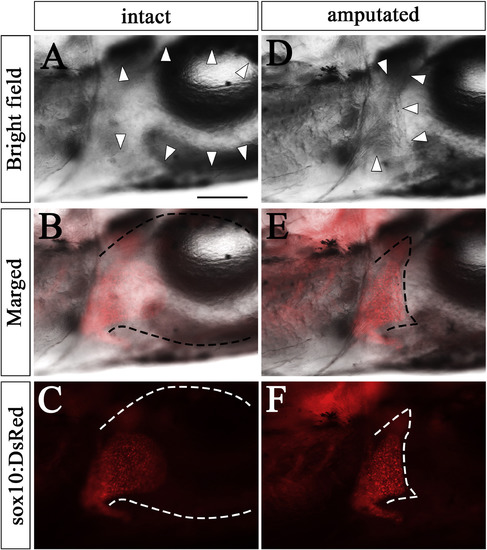
How to draw dotted lines outlining the circumference of pectoral fins. Pectoral fins of sox10:DsRed zebrafish (SL: 6.4). (A, B, C) The same samples as in Fig. 4A. (D, E, F) The same sample as in Fig. 4G. (A, D) Bright field photos of pectoral fins with high contrast for visualizing the circumference. White arrowheads indicate circumference of the pectoral fin. (B, E) Merged photos of bright field and sox10:DeRed with black dotted lines drawn along the circumference. (C, F) Bright field photos removed and only sox10:DsRed photos with white dotted lines for the circumference are shown. Scale bar: 200 μm in A. |
|
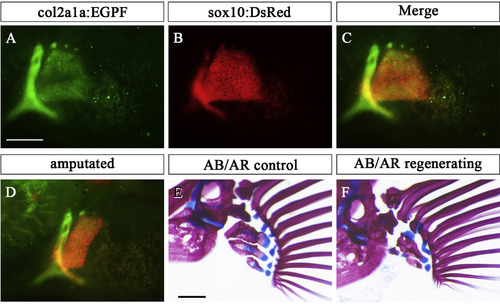
Endoskeleton of pectoral fin in col2a1a:EGFP;sox10:DsRed double transgenic fish. (A-C) Expression pattern of col2a1a:EGFP (A), sox10:DsRed (B), and merged view (C) in the chondrocytes of the pectoral fin. (D) Amputated pectoral fin of col2a1a:EGFP; sox10:DsRed double transgenic fish. (E, F) Pectoral fin skeletons in col2a1a:EGFP; sox10:DsRed double transgenic fish stained with AR and AB at 28 dpA: contralateral control (E) and regenerated (F) pectoral fins. Scale bar: 200 μm in A, D and E. |
|
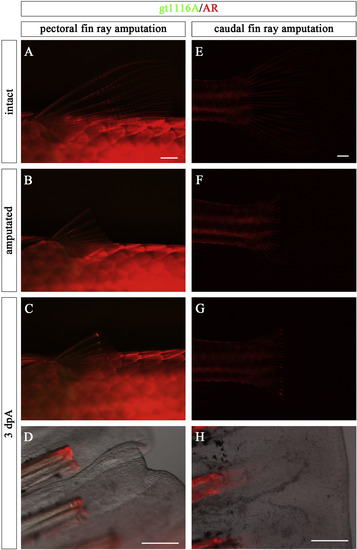
EGFP of gt1116A was not expressed in blastema during fin ray regeneration. (A) Pre-amputation pectoral fin of gt1116A zebrafish stained with AR. (B) Post-amputation pectoral fin of gt1116A. (C, D) EGFP is not expressed in the regenerating pectoral fin. D is the magnified view of C merged with a bright-field photo. (E) Pre-amputation caudal fin of gt1116A zebrafish stained with AR. (F) Post-amputation caudal fin of gt1116A zebrafish. (G, H) EGFP is not expressed in regenerating caudal fin in gt1116A. H is the magnified view of G with a bright-field photo. Scale bars: 1 mm in A, E and 200 μm in D, H. |
Reprinted from Developmental Biology, 463(2), Yoshida, K., Kawakami, K., Abe, G., Tamura, K., Zebrafish can regenerate endoskeleton in larval pectoral fin but the regenerative ability declines, 110-123, Copyright (2020) with permission from Elsevier. Full text @ Dev. Biol.

