
- Title
-
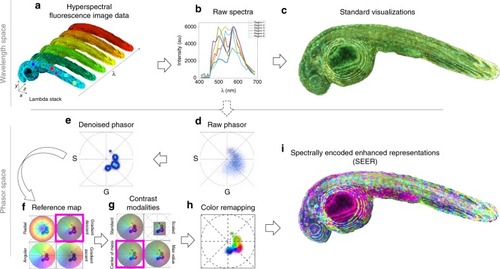
Pre-processing visualization of hyperspectral fluorescent data with Spectrally Encoded Enhanced Representations
- Authors
- Shi, W., Koo, D.E.S., Kitano, M., Chiang, H.J., Trinh, L.A., Turcatel, G., Steventon, B., Arnesano, C., Warburton, D., Fraser, S.E., Cutrale, F.
- Source
- Full text @ Nat. Commun.
|
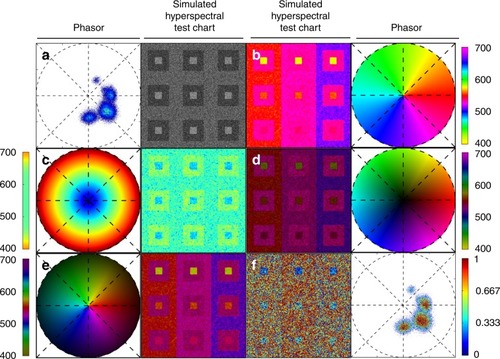
A set of standard reference maps and their corresponding result on a Simulated Hyperspectral Test Chart (SHTC) designed to provide a gradient of spectral overlaps between spectra. |
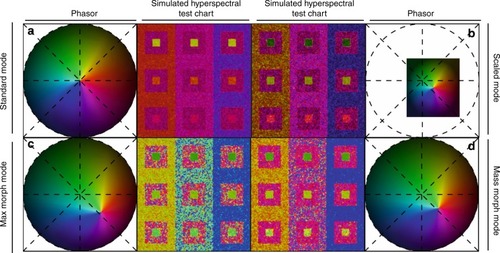
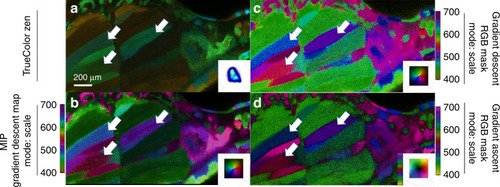
For each SEER standard reference map design, four different modes can provide improved contrast during visualization. As a reference we use the gradient descent map applied on a Simulated Hyperspectral Test Chart (SHTC). |
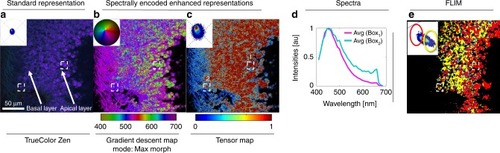
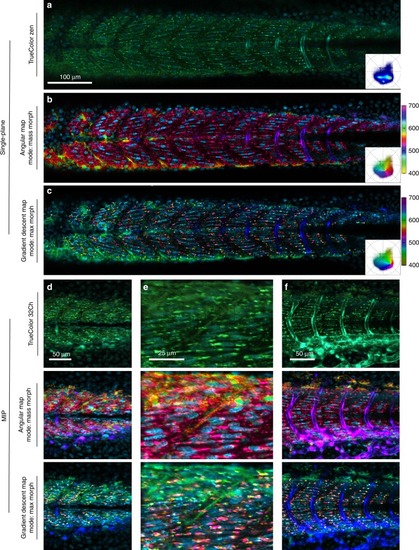
The sample was imaged using multispectral two-photon microscopy (740 nm excitation, 32 wavelength bins, 8.9 nm bandwidth, 410–695 nm detection) to collect the fluorescence of intrinsic molecules including folic acid, retinoids and NADH in its free and bound states. These intrinsic molecules have been used as reporters for metabolic activity in tissues by measuring their fluorescence lifetime, instead of wavelength, due to their closely overlapping emission spectra. This overlap increases the difficulty in distinguishing spectral changes when utilizing a ( |
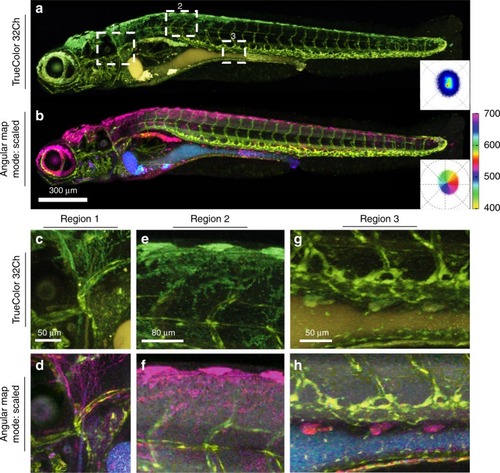
Tg( |
Zebrafish embryo |
Maximum intensity projection renderings of |