|
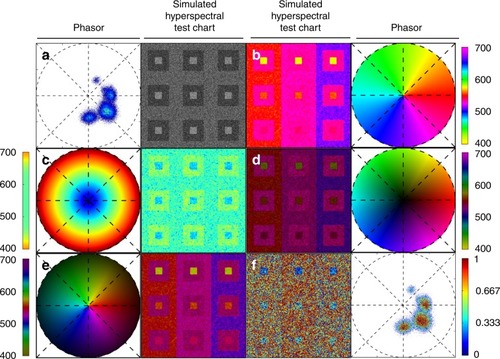
Spectrally Encoded Enhanced Representation (SEER) designs.A set of standard reference maps and their corresponding result on a Simulated Hyperspectral Test Chart (SHTC) designed to provide a gradient of spectral overlaps between spectra. a The Standard phasor plot with corresponding average grayscale image provides the positional information of the spectra on the phasor plot. The phasor position is associated to a color in the rendering according to a set of standard reference maps, each highlighting a different property of the dataset. b The angular map enhances spectral phase differences by linking color to changes in angle (in this case, with respect to origin). This map enhances changes in maximum emission wavelength, as phase position in the plot is most sensitive to this feature, and largely agnostic to changes in intensity. c The radial map, instead, focuses mainly on intensity changes, as a decrease in the signal-to-noise generally results in shifts towards the origin on the phasor plot. As a result, this map highlights spectral amplitude and magnitude, and is mostly insensitive to wavelength changes for the same spectrum. d The gradient ascent map enhances spectral differences, especially within the higher intensity regions in the specimen. This combination is achieved by adding a brightness component to the color palette. Darker hues are localized in the center of the map, where lower image intensities are plotted. e The gradient descent map improves the rendering of subtle differences in wavelength. Colorbars for b, c, d, e represent the main wavelength associated to one color in nanometers. f The tensor map provides insights in statistical changes of spectral populations in the image. This visualization acts as a spectral edge detection on the image and can simplify identification of spectrally different and infrequent areas of the sample such as the center of the SHTC. Colorbar represents the normalized relative gradient of counts.
|