FIGURE

Fig. 7

ID
ZDB-FIG-200514-7
Publication
Shi et al., 2020 - Pre-processing visualization of hyperspectral fluorescent data with Spectrally Encoded Enhanced Representations
Other Figures
All Figure Page
Back to All Figure Page
Fig. 7

Visualization of combinatorial expression on Zebrabow samples.

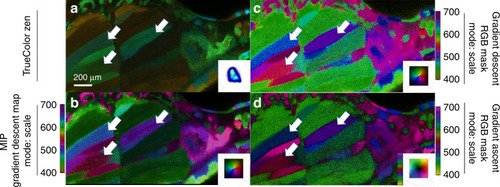
Maximum intensity projection renderings of Tg(ubi:Zebrabow) muscle34 acquired live in multispectral confocal mode with 458 nm excitation. a The elicited signal (e.g., white arrows) is difficult to interpret in the TrueColor Image display (Zen Software, Zeiss, Germany). b Discerning spectral differences is increasingly simpler with gradient descent map scaled to intensities, while compromising on the brightness of the image. c Gradient descent and d gradient ascent RGB masks in scale mode show the color values assigned to each pixel and greatly improve the visual separation of recombined CFP, YFP, and RFP labels. Colorbars represent the main wavelength associated to one color in nanometers.

Expression Data

Expression Detail
Antibody Labeling
Phenotype Data

Phenotype Detail
Acknowledgments
This image is the copyrighted work of the attributed author or publisher, and ZFIN has permission only to display this image to its users. Additional permissions should be obtained from the applicable author or publisher of the image. Full text @ Nat. Commun.