|
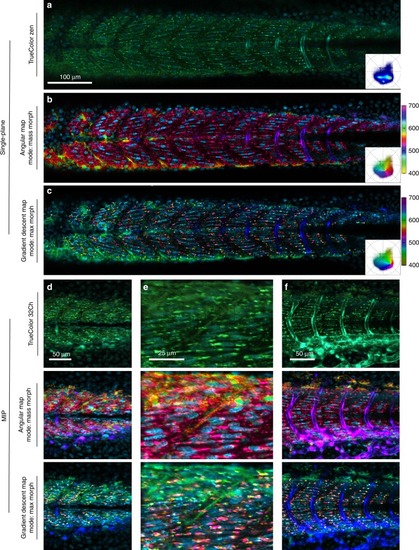
Triple label fluorescence visualization.Zebrafish embryo Tg(kdrl:eGFP); Gt(desmin-Citrine);Tg(ubiq:H2B-Cerulean) labeling, respectively, vasculature, muscle, and nuclei. Live imaging with a multispectral confocal microscope (32-channels) using 458 nm excitation. Single plane slices of the tiled volume are rendered with TrueColor and SEER maps. a TrueColor image display (Zen, Zeiss, Germany). b Angular map in center of mass morph mode improves contrast by distinguishable colors. The resulting visualization enhances the spatial localization of fluorophores in the sample. c Gradient descent map in max morph mode centers the color palette on the most frequent spectrum in the sample, highlighting the spectral changes relative to it. In this sample, the presence of skin pigment cells (green) is enhanced. 3D visualization of SEER maintains these enhancement properties. Colorbars represent the main wavelength associated to one color in nanometers. Here we show (d, e, f) TrueColor 32 channels Maximum Intensity Projections (MIP) of different sections of the specimen rendered in TrueColor, angular map center of mass mode and gradient descent max mode. The selected views highlight SEER’s performance in the d overview of somites, e zoom-in of somite boundary, and f lateral view of vascular system.
|