IMAGE

Fig. 4

ID
ZDB-IMAGE-200514-5
Source
Figures for Shi et al., 2020
Image
Figure Caption

Fig. 4 Autofluorescence visualization comparison for unlabeled freshly isolated mouse tracheal explant.

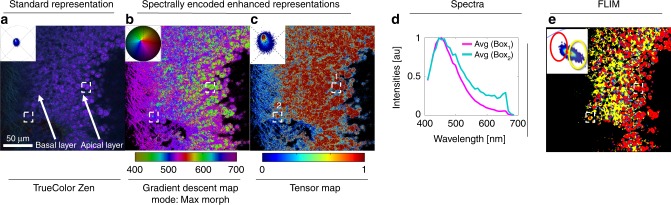
The sample was imaged using multispectral two-photon microscopy (740 nm excitation, 32 wavelength bins, 8.9 nm bandwidth, 410–695 nm detection) to collect the fluorescence of intrinsic molecules including folic acid, retinoids and NADH in its free and bound states. These intrinsic molecules have been used as reporters for metabolic activity in tissues by measuring their fluorescence lifetime, instead of wavelength, due to their closely overlapping emission spectra. This overlap increases the difficulty in distinguishing spectral changes when utilizing a (a) TrueColor image display (Zen Software, Zeiss, Germany). b The gradient descent morphed map shows differences between apical and basal layers, suggesting different metabolic activities of cells based on the distance from the tracheal airway. Cells on the apical and basal layer (dashed boxes) are rendered with distinct color groups. Colorbar represents the main wavelength associated to one color in nanometers. c The tensor map image provides an insight of statistics in the spectral dataset, associating image pixels’ colors with corresponding gradient of phasor counts for pixels with similar spectra. The spectral counts gradients in this sample highlights the presence of fibers and edges of single cells. Colorbar represents the normalized relative gradient of counts. d Average spectra for the cells in dashed boxes (1 and 2 in panel c) show a blue spectral shift in the direction of the apical layer. e Fluorescence Lifetime Image Microscopy (FLIM) of the sample, acquired using a frequency domain detector validates the interpretation from panel (b), Gradient descent map, where cells in the apical layer exhibit a more oxidative phosphorylation phenotype (longer lifetime in red) compared with cells in the basal layer (shorter lifetime in yellow) with a more glycolytic phenotype. The selections correspond to areas selected in phasor FLIM analysis (e, top left inset, red and yellow selections) based on the relative phasor coordinates of NAD+/NADH lifetimes35.

Acknowledgments
This image is the copyrighted work of the attributed author or publisher, and ZFIN has permission only to display this image to its users. Additional permissions should be obtained from the applicable author or publisher of the image. Full text @ Nat. Commun.